The Hartford 2014 Annual Report Download - page 113
Download and view the complete annual report
Please find page 113 of the 2014 The Hartford annual report below. You can navigate through the pages in the report by either clicking on the pages listed below, or by using the keyword search tool below to find specific information within the annual report.-
 1
1 -
2
-
3
-
4
-
5
-
6
-
7
-
8
-
9
-
10
-
11
-
12
-
13
-
14
-
15
-
16
-
17
-
18
-
19
-
20
-
21
-
22
-
23
-
24
-
25
-
26
-
27
-
28
-
29
-
30
-
31
-
32
-
33
-
34
-
35
-
36
-
37
-
38
-
39
-
40
-
41
-
42
-
43
-
44
-
45
-
46
-
47
-
48
-
49
-
50
-
51
-
52
-
53
-
54
-
55
-
56
-
57
-
58
-
59
-
60
-
61
-
62
-
63
-
64
-
65
-
66
-
67
-
68
-
69
-
70
-
71
-
72
-
73
-
74
-
75
-
76
-
77
-
78
-
79
-
80
-
81
-
82
-
83
-
84
-
85
-
86
-
87
-
88
-
89
-
90
-
91
-
92
-
93
-
94
-
95
-
96
-
97
-
98
-
99
-
100
-
101
-
102
-
 103
103 -
 104
104 -
 105
105 -
 106
106 -
 107
107 -
 108
108 -
 109
109 -
 110
110 -
 111
111 -
 112
112 -
 113
113 -
 114
114 -
 115
115 -
 116
116 -
 117
117 -
 118
118 -
 119
119 -
 120
120 -
 121
121 -
 122
122 -
 123
123 -
124
-
125
-
126
-
127
-
128
-
129
-
130
-
131
-
132
-
133
-
134
-
135
-
136
-
137
-
138
-
139
-
140
-
141
-
142
-
143
-
144
-
145
-
146
-
147
-
148
-
149
-
150
-
151
-
152
-
153
-
154
-
155
-
156
-
157
-
158
-
159
-
160
-
161
-
162
-
163
-
164
-
165
-
166
-
167
-
168
-
169
-
170
-
171
-
172
-
173
-
174
-
175
-
176
-
177
-
178
-
179
-
180
-
181
-
182
-
183
-
184
-
185
-
186
-
187
-
188
-
189
-
190
-
191
-
192
-
193
-
194
-
195
-
196
-
197
-
198
-
199
-
200
-
201
-
202
-
203
-
204
-
205
-
206
-
207
-
208
-
209
-
210
-
211
-
212
-
213
-
214
-
215
-
216
-
217
-
218
-
219
-
220
-
221
-
222
-
223
-
224
-
225
-
226
-
227
-
228
-
229
-
230
-
231
-
232
-
233
-
234
-
235
-
236
-
237
-
238
-
239
-
240
-
241
-
242
-
243
-
244
-
245
-
246
-
247
-
248
-
249
-
250
-
251
-
252
-
253
-
254
-
255
-
256
-
257
-
258
-
259
-
260
-
261
-
262
-
263
-
264
-
265
-
266
-
267
-
268
-
269
-
270
-
271
-
272
-
273
-
274
-
275
-
276
-
277
-
278
-
279
-
280
-
281
-
282
-
283
-
284
-
285
-
286
-
287
-
288
-
289
-
290
-
291
-
292
-
293
-
294
-
295
-
296
 |
 |

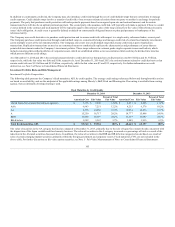
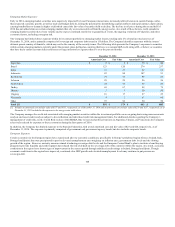
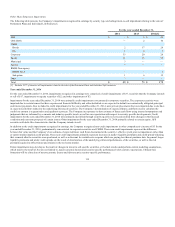
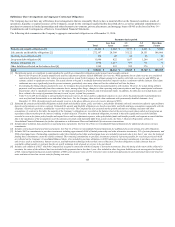
Municipal Bonds
The following table summarizes the amortized cost, fair value, and weighted average credit quality of the Company's available-for-sale investments in
securities backed by states, municipalities and political subdivisions (“municipal bonds”).
General Obligation $ 2,259
$ 2,480
AA
$ 2,358
$ 2,455
AA
Pre-Refunded [1] 716
748
AAA
567
605
AAA
Revenue
Transportation 1,599
1,781
A+
1,880
1,879
A
Health Care 1,412
1,560
AA-
1,305
1,335
AA
Water & Sewer 1,204
1,308
AA
1,455
1,476
AA-
Education 1,115
1,232
AA
1,077
1,105
AA
Sales Tax 916
1,020
AA-
793
795
AA-
Leasing [2]
772
858
AA-
877
897
AA-
Power 739
814
A+
706
722
A+
Housing 148
153
AA
177
171
AA
Other 855
917
AA-
737
733
A+
Total Revenue 8,760
9,643
AA-
9,007
9,113
AA-
[1] Pre-refunded bonds are bonds for which an irrevocable trust containing sufficient U.S. treasury, agency, or other securities has been established to fund the remaining
payment of principal and interest.
[2] Leasing revenue bonds are generally the obligations of a financing authority established by the municipality that leases municipal facilities to a municipality. The notes are
typically secured by lease payments made by the municipality that is leasing the facilities financed by the issue. Lease payments may be subject to annual appropriation by the
municipality or the municipality may be obligated to appropriate general tax revenues to make lease payments.
The overall increase in the fair value of municipal bonds is primarily due to the decline in interest rates and tighter credit spreads. As of December 31, 2014
and December 31, 2013, the largest issuer concentrations were the states of Illinois, California and Massachusetts, which each comprised less than 3% of the
municipal bond portfolio and were primarily comprised of general obligation and taxable bonds.
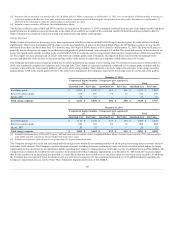
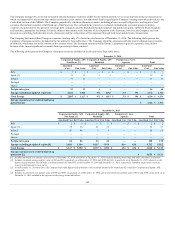
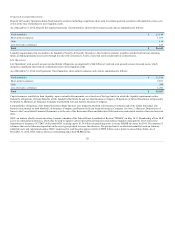
Limited Partnerships and Other Alternative Investments
The following table presents the Company’s investments in limited partnerships and other alternative investments which include hedge funds, mortgage and
real estate funds, mezzanine debt funds, and private equity and other funds. Hedge funds are comprised of approximately half credit and equity related funds
and approximately half global macro related funds with a market neutral focus. Mortgage and real estate funds consist of investments in funds whose assets
consist of mortgage loans, mortgage loan participations, mezzanine loans or other notes which may be below investment grade, as well as equity real estate
and real estate joint ventures. Mezzanine debt funds include investments in funds whose assets consist of subordinated debt that often incorporates equity-
based options such as warrants and a limited amount of direct equity investments. Private equity and other funds primarily consist of investments in funds
whose assets typically consist of a diversified pool of investments in small to mid-sized non-public businesses with high growth potential.
Hedge funds $ 1,187 40.3% $ 1,341 44.1%
Mortgage and real estate funds 561 19.1% 534 17.6%
Mezzanine debt funds 61 2.1% 82 2.7%
Private equity and other funds 1,133 38.5% 1,083 35.6%
113