The Hartford 2014 Annual Report Download - page 137
Download and view the complete annual report
Please find page 137 of the 2014 The Hartford annual report below. You can navigate through the pages in the report by either clicking on the pages listed below, or by using the keyword search tool below to find specific information within the annual report.-
 1
1 -
2
-
3
-
4
-
5
-
6
-
7
-
8
-
9
-
10
-
11
-
12
-
13
-
14
-
15
-
16
-
17
-
18
-
19
-
20
-
21
-
22
-
23
-
24
-
25
-
26
-
27
-
28
-
29
-
30
-
31
-
32
-
33
-
34
-
35
-
36
-
37
-
38
-
39
-
40
-
41
-
42
-
43
-
44
-
45
-
46
-
47
-
48
-
49
-
50
-
51
-
52
-
53
-
54
-
55
-
56
-
57
-
58
-
59
-
60
-
61
-
62
-
63
-
64
-
65
-
66
-
67
-
68
-
69
-
70
-
71
-
72
-
73
-
74
-
75
-
76
-
77
-
78
-
79
-
80
-
81
-
82
-
83
-
84
-
85
-
86
-
87
-
88
-
89
-
90
-
91
-
92
-
93
-
94
-
95
-
96
-
97
-
98
-
99
-
100
-
101
-
102
-
103
-
104
-
105
-
106
-
107
-
108
-
109
-
110
-
111
-
112
-
113
-
114
-
115
-
116
-
117
-
118
-
119
-
120
-
121
-
122
-
123
-
124
-
125
-
126
-
 127
127 -
 128
128 -
 129
129 -
 130
130 -
 131
131 -
 132
132 -
 133
133 -
 134
134 -
 135
135 -
 136
136 -
 137
137 -
 138
138 -
 139
139 -
 140
140 -
 141
141 -
 142
142 -
 143
143 -
 144
144 -
 145
145 -
 146
146 -
 147
147 -
148
-
149
-
150
-
151
-
152
-
153
-
154
-
155
-
156
-
157
-
158
-
159
-
160
-
161
-
162
-
163
-
164
-
165
-
166
-
167
-
168
-
169
-
170
-
171
-
172
-
173
-
174
-
175
-
176
-
177
-
178
-
179
-
180
-
181
-
182
-
183
-
184
-
185
-
186
-
187
-
188
-
189
-
190
-
191
-
192
-
193
-
194
-
195
-
196
-
197
-
198
-
199
-
200
-
201
-
202
-
203
-
204
-
205
-
206
-
207
-
208
-
209
-
210
-
211
-
212
-
213
-
214
-
215
-
216
-
217
-
218
-
219
-
220
-
221
-
222
-
223
-
224
-
225
-
226
-
227
-
228
-
229
-
230
-
231
-
232
-
233
-
234
-
235
-
236
-
237
-
238
-
239
-
240
-
241
-
242
-
243
-
244
-
245
-
246
-
247
-
248
-
249
-
250
-
251
-
252
-
253
-
254
-
255
-
256
-
257
-
258
-
259
-
260
-
261
-
262
-
263
-
264
-
265
-
266
-
267
-
268
-
269
-
270
-
271
-
272
-
273
-
274
-
275
-
276
-
277
-
278
-
279
-
280
-
281
-
282
-
283
-
284
-
285
-
286
-
287
-
288
-
289
-
290
-
291
-
292
-
293
-
294
-
295
-
296
 |
 |

Table of Contents
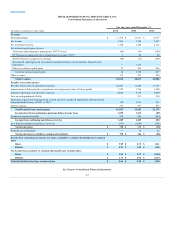
Consolidated Statements of Operations
(In millions, except for per share data)
Revenues
Earned premiums $ 13,336 $ 13,231 $ 13,637
Fee income 1,996 2,105 3,567
Net investment income 3,154 3,264 4,127
Net realized capital gains (losses):
Total other-than-temporary impairment (“OTTI”) losses (64) (93) (389)
OTTI losses recognized in other comprehensive income (“OCI”) 5 20 40
Net OTTI losses recognized in earnings (59) (73) (349)
Net realized capital gains on investments transferred at fair value in business disposition by
reinsurance — 1,575 —
Other net realized capital gains 75 296 846
Total net realized capital gains 16 1,798 497
Other revenues 112 275 258
Benefits, losses and expenses
Benefits, losses and loss adjustment expenses 10,805 11,048 13,195
Amortization of deferred policy acquisition costs and present value of future profits 1,729 1,794 1,990
Insurance operating costs and other expenses 4,028 4,176 5,090
Loss on extinguishment of debt — 213 910
Reinsurance (gain) loss on disposition in 2014 and 2013, goodwill impairment of $342 in 2012
and premium deficiency of $191 in 2012 (23) 1,574 533
Interest expense 376 397 457
Income tax expense (benefit) 350 246 (309)
Loss from discontinued operations, net of tax (551) (1,049) (258)
Preferred stock dividends — 10 42
Income from continuing operations, net of tax, available to common shareholders per common
share
Net income (loss) available to common shareholders per common share
See Notes to Consolidated Financial Statements.
F-3