The Hartford 2014 Annual Report Download - page 229
Download and view the complete annual report
Please find page 229 of the 2014 The Hartford annual report below. You can navigate through the pages in the report by either clicking on the pages listed below, or by using the keyword search tool below to find specific information within the annual report.-
 1
1 -
2
-
3
-
4
-
5
-
6
-
7
-
8
-
9
-
10
-
11
-
12
-
13
-
14
-
15
-
16
-
17
-
18
-
19
-
20
-
21
-
22
-
23
-
24
-
25
-
26
-
27
-
28
-
29
-
30
-
31
-
32
-
33
-
34
-
35
-
36
-
37
-
38
-
39
-
40
-
41
-
42
-
43
-
44
-
45
-
46
-
47
-
48
-
49
-
50
-
51
-
52
-
53
-
54
-
55
-
56
-
57
-
58
-
59
-
60
-
61
-
62
-
63
-
64
-
65
-
66
-
67
-
68
-
69
-
70
-
71
-
72
-
73
-
74
-
75
-
76
-
77
-
78
-
79
-
80
-
81
-
82
-
83
-
84
-
85
-
86
-
87
-
88
-
89
-
90
-
91
-
92
-
93
-
94
-
95
-
96
-
97
-
98
-
99
-
100
-
101
-
102
-
103
-
104
-
105
-
106
-
107
-
108
-
109
-
110
-
111
-
112
-
113
-
114
-
115
-
116
-
117
-
118
-
119
-
120
-
121
-
122
-
123
-
124
-
125
-
126
-
127
-
128
-
129
-
130
-
131
-
132
-
133
-
134
-
135
-
136
-
137
-
138
-
139
-
140
-
141
-
142
-
143
-
144
-
145
-
146
-
147
-
148
-
149
-
150
-
151
-
152
-
153
-
154
-
155
-
156
-
157
-
158
-
159
-
160
-
161
-
162
-
163
-
164
-
165
-
166
-
167
-
168
-
169
-
170
-
171
-
172
-
173
-
174
-
175
-
176
-
177
-
178
-
179
-
180
-
181
-
182
-
183
-
184
-
185
-
186
-
187
-
188
-
189
-
190
-
191
-
192
-
193
-
194
-
195
-
196
-
197
-
198
-
199
-
200
-
201
-
202
-
203
-
204
-
205
-
206
-
207
-
208
-
209
-
210
-
211
-
212
-
213
-
214
-
215
-
216
-
217
-
218
-
 219
219 -
 220
220 -
 221
221 -
 222
222 -
 223
223 -
 224
224 -
 225
225 -
 226
226 -
 227
227 -
 228
228 -
 229
229 -
 230
230 -
 231
231 -
 232
232 -
 233
233 -
 234
234 -
 235
235 -
 236
236 -
 237
237 -
 238
238 -
 239
239 -
240
-
241
-
242
-
243
-
244
-
245
-
246
-
247
-
248
-
249
-
250
-
251
-
252
-
253
-
254
-
255
-
256
-
257
-
258
-
259
-
260
-
261
-
262
-
263
-
264
-
265
-
266
-
267
-
268
-
269
-
270
-
271
-
272
-
273
-
274
-
275
-
276
-
277
-
278
-
279
-
280
-
281
-
282
-
283
-
284
-
285
-
286
-
287
-
288
-
289
-
290
-
291
-
292
-
293
-
294
-
295
-
296
 |
 |
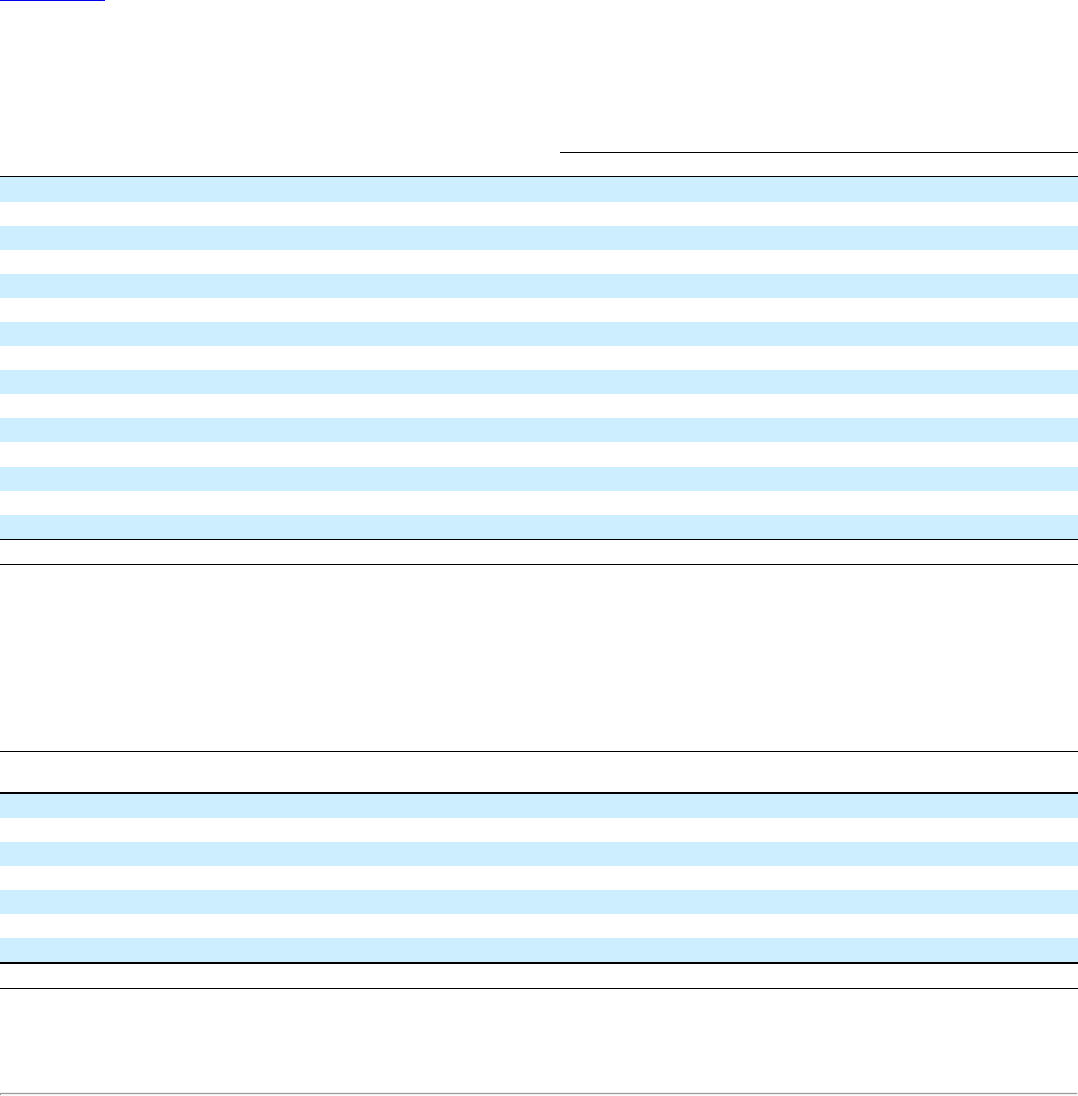
Table of Contents
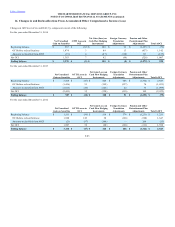
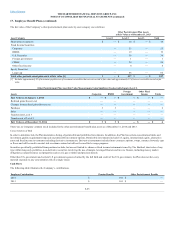
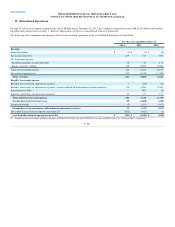
The fair values of the Company’s pension plan assets by asset category are as follows:
Short-term investments: $ 13 $ 364 $ — $ 377
Fixed Income Securities:
Corporate — 890 12 902
RMBS — 156 2 158
U.S. Treasuries 10 922 1 933
Foreign government — 42 4 46
CMBS — 196 1 197
Other fixed income [1] — 85 10 95
Equity Securities:
Large-cap domestic — 514 — 514
Mid-cap domestic 50 — — 50
Small-cap domestic 50 — — 50
International 459 1 — 460
Other investments:
Hedge funds — 499 361 860
[1] Includes ABS and municipal bonds.
[2] Excludes approximately $34 of investment payables net of investment receivables that are excluded from this disclosure requirement because they are trade receivables in the
ordinary course of business where the carrying amount approximates fair value. Also excludes approximately $22 of interest receivable.
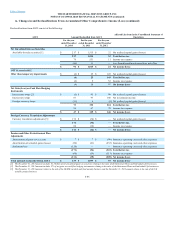
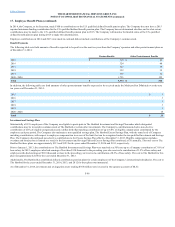
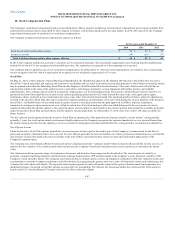
The tables below provide fair value level 3 rollforwards for the Pension Plan Assets for which significant unobservable inputs (Level 3) are used in the fair
value measurement on a recurring basis. The Plan classifies the fair value of financial instruments within Level 3 if there are no observable markets for the
instruments or, in the absence of active markets, if one or more of the significant inputs used to determine fair value are based on the Plan’s own assumptions.
Therefore, the gains and losses in the tables below include changes in fair value due to both observable and unobservable factors.
Realized gains (losses), net — — — — 4 4
Changes in unrealized gains (losses), net — 7 1 (5) 4 7
Purchases 12 3 2 6 219 242
Sales (5) (1) (2) (2) (183) (193)
Transfers into Level 3 20 17 — 7 — 44
Transfers out of Level 3 (5) — — (9) (224) (238)
During the year ended December 31, 2014, transfers into and (out) of Level 3 are primarily attributable to the appearance of or lack thereof of market
observable information and the re-evaluation of the observability of pricing inputs.
F-93