The Hartford 2014 Annual Report Download - page 114
Download and view the complete annual report
Please find page 114 of the 2014 The Hartford annual report below. You can navigate through the pages in the report by either clicking on the pages listed below, or by using the keyword search tool below to find specific information within the annual report.-
 1
1 -
2
-
3
-
4
-
5
-
6
-
7
-
8
-
9
-
10
-
11
-
12
-
13
-
14
-
15
-
16
-
17
-
18
-
19
-
20
-
21
-
22
-
23
-
24
-
25
-
26
-
27
-
28
-
29
-
30
-
31
-
32
-
33
-
34
-
35
-
36
-
37
-
38
-
39
-
40
-
41
-
42
-
43
-
44
-
45
-
46
-
47
-
48
-
49
-
50
-
51
-
52
-
53
-
54
-
55
-
56
-
57
-
58
-
59
-
60
-
61
-
62
-
63
-
64
-
65
-
66
-
67
-
68
-
69
-
70
-
71
-
72
-
73
-
74
-
75
-
76
-
77
-
78
-
79
-
80
-
81
-
82
-
83
-
84
-
85
-
86
-
87
-
88
-
89
-
90
-
91
-
92
-
93
-
94
-
95
-
96
-
97
-
98
-
99
-
100
-
101
-
102
-
103
-
 104
104 -
 105
105 -
 106
106 -
 107
107 -
 108
108 -
 109
109 -
 110
110 -
 111
111 -
 112
112 -
 113
113 -
 114
114 -
 115
115 -
 116
116 -
 117
117 -
 118
118 -
 119
119 -
 120
120 -
 121
121 -
 122
122 -
 123
123 -
 124
124 -
125
-
126
-
127
-
128
-
129
-
130
-
131
-
132
-
133
-
134
-
135
-
136
-
137
-
138
-
139
-
140
-
141
-
142
-
143
-
144
-
145
-
146
-
147
-
148
-
149
-
150
-
151
-
152
-
153
-
154
-
155
-
156
-
157
-
158
-
159
-
160
-
161
-
162
-
163
-
164
-
165
-
166
-
167
-
168
-
169
-
170
-
171
-
172
-
173
-
174
-
175
-
176
-
177
-
178
-
179
-
180
-
181
-
182
-
183
-
184
-
185
-
186
-
187
-
188
-
189
-
190
-
191
-
192
-
193
-
194
-
195
-
196
-
197
-
198
-
199
-
200
-
201
-
202
-
203
-
204
-
205
-
206
-
207
-
208
-
209
-
210
-
211
-
212
-
213
-
214
-
215
-
216
-
217
-
218
-
219
-
220
-
221
-
222
-
223
-
224
-
225
-
226
-
227
-
228
-
229
-
230
-
231
-
232
-
233
-
234
-
235
-
236
-
237
-
238
-
239
-
240
-
241
-
242
-
243
-
244
-
245
-
246
-
247
-
248
-
249
-
250
-
251
-
252
-
253
-
254
-
255
-
256
-
257
-
258
-
259
-
260
-
261
-
262
-
263
-
264
-
265
-
266
-
267
-
268
-
269
-
270
-
271
-
272
-
273
-
274
-
275
-
276
-
277
-
278
-
279
-
280
-
281
-
282
-
283
-
284
-
285
-
286
-
287
-
288
-
289
-
290
-
291
-
292
-
293
-
294
-
295
-
296
 |
 |

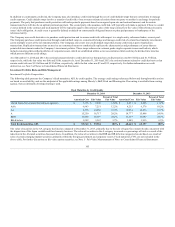
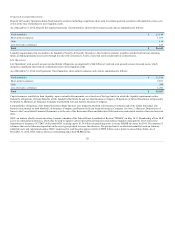
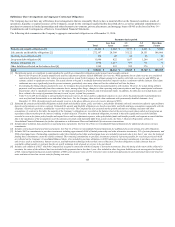
Available-for-Sale Securities — Unrealized Loss Aging
The total gross unrealized losses were $385 as of December 31, 2014, and have decreased $692, or 64%, from December 31, 2013, primarily due to a decrease
in interest rates as well as sales. As of December 31, 2014, $324 of the gross unrealized losses were associated with securities depressed less than 20% of cost
or amortized cost.
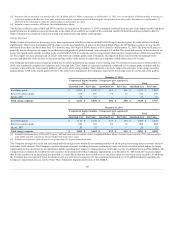
The remaining $61 of gross unrealized losses were associated with securities depressed greater than 20%. The securities depressed more than 20% are
primarily corporate and equity securities within the energy sector, and securities with exposure to commercial real estate that have market spreads that are
wider than the spreads at the securities' respective purchase dates. Unrealized losses on corporate and equity securities in the energy sector is primarily the
result of the recent decline in oil prices previously discussed; see Exposure to the Energy Sector in the Investment Portfolio Risks and Risk Management
section of this MD&A. Unrealized losses on securities with exposure to commercial and residential real estate are largely due to the continued market and
economic uncertainties surrounding the performance of certain structures or vintages. Based on the Company’s cash flow modeling and current market and
collateral performance assumptions, these securities with exposure to commercial real estate have sufficient credit protection levels to receive contractually
obligated principal and interest payments.
As part of the Company’s ongoing security monitoring process, the Company has reviewed its AFS securities in an unrealized loss position and concluded
that these securities are temporarily depressed and are expected to recover in value as the securities approach maturity or as real estate related market spreads
continue to improve. For these securities in an unrealized loss position where a credit impairment has not been recorded, the Company’s best estimate of
expected future cash flows are sufficient to recover the amortized cost basis of the security. Furthermore, the Company neither has an intention to sell nor
does it expect to be required to sell these securities. For further information regarding the Company’s impairment analysis, see Other-Than-Temporary
Impairments in the Investment Portfolio Risks and Risk Management section of this MD&A.
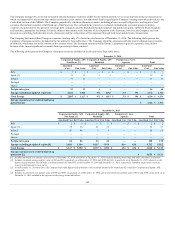
The following table presents the Company’s unrealized loss aging for AFS securities by length of time the security was in a continuous unrealized loss
position.
Three months or less 1,412 $ 4,014 $ 3,963 $ (51) 1,184 $ 10,056 $ 9,939 $ (117)
Greater than three to six months 643 1,739 1,665 (74) 349 1,200 1,167 (33)
Greater than six to nine months 220 417 404 (13) 956 6,362 5,988 (374)
Greater than nine to eleven months 102 148 142 (6) 148 413 374 (39)
Twelve months or more 688 4,667 4,429 (241) 578 5,625 5,109 (514)
[1] Unrealized losses exclude the fair value of bifurcated embedded derivative features of certain securities as changes in value are recorded in net realized capital gains (losses).
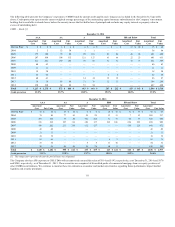
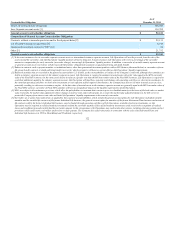
The following tables present the Company’s unrealized loss aging for AFS securities continuously depressed over 20% by length of time (included in the
table above).
Three months or less 137 $ 152 $ 113 $ (39) 63 $ 213 $ 162 $ (51)
Greater than three to six months 39 17 11 (6) 20 177 130 (47)
Greater than six to nine months 11 4 1 (3) 28 449 336 (113)
Greater than nine to eleven months 9 1 — (1) 10 4 3 (1)
Twelve months or more 49 31 19 (12) 58 132 93 (39)
[1] Unrealized losses exclude the fair value of bifurcated embedded derivatives features of certain securities as changes in value are recorded in net realized capital gains
(losses).
114