The Hartford 2014 Annual Report Download - page 109
Download and view the complete annual report
Please find page 109 of the 2014 The Hartford annual report below. You can navigate through the pages in the report by either clicking on the pages listed below, or by using the keyword search tool below to find specific information within the annual report.-
 1
1 -
2
-
3
-
4
-
5
-
6
-
7
-
8
-
9
-
10
-
11
-
12
-
13
-
14
-
15
-
16
-
17
-
18
-
19
-
20
-
21
-
22
-
23
-
24
-
25
-
26
-
27
-
28
-
29
-
30
-
31
-
32
-
33
-
34
-
35
-
36
-
37
-
38
-
39
-
40
-
41
-
42
-
43
-
44
-
45
-
46
-
47
-
48
-
49
-
50
-
51
-
52
-
53
-
54
-
55
-
56
-
57
-
58
-
59
-
60
-
61
-
62
-
63
-
64
-
65
-
66
-
67
-
68
-
69
-
70
-
71
-
72
-
73
-
74
-
75
-
76
-
77
-
78
-
79
-
80
-
81
-
82
-
83
-
84
-
85
-
86
-
87
-
88
-
89
-
90
-
91
-
92
-
93
-
94
-
95
-
96
-
97
-
98
-
 99
99 -
 100
100 -
 101
101 -
 102
102 -
 103
103 -
 104
104 -
 105
105 -
 106
106 -
 107
107 -
 108
108 -
 109
109 -
 110
110 -
 111
111 -
 112
112 -
 113
113 -
 114
114 -
 115
115 -
 116
116 -
 117
117 -
 118
118 -
 119
119 -
120
-
121
-
122
-
123
-
124
-
125
-
126
-
127
-
128
-
129
-
130
-
131
-
132
-
133
-
134
-
135
-
136
-
137
-
138
-
139
-
140
-
141
-
142
-
143
-
144
-
145
-
146
-
147
-
148
-
149
-
150
-
151
-
152
-
153
-
154
-
155
-
156
-
157
-
158
-
159
-
160
-
161
-
162
-
163
-
164
-
165
-
166
-
167
-
168
-
169
-
170
-
171
-
172
-
173
-
174
-
175
-
176
-
177
-
178
-
179
-
180
-
181
-
182
-
183
-
184
-
185
-
186
-
187
-
188
-
189
-
190
-
191
-
192
-
193
-
194
-
195
-
196
-
197
-
198
-
199
-
200
-
201
-
202
-
203
-
204
-
205
-
206
-
207
-
208
-
209
-
210
-
211
-
212
-
213
-
214
-
215
-
216
-
217
-
218
-
219
-
220
-
221
-
222
-
223
-
224
-
225
-
226
-
227
-
228
-
229
-
230
-
231
-
232
-
233
-
234
-
235
-
236
-
237
-
238
-
239
-
240
-
241
-
242
-
243
-
244
-
245
-
246
-
247
-
248
-
249
-
250
-
251
-
252
-
253
-
254
-
255
-
256
-
257
-
258
-
259
-
260
-
261
-
262
-
263
-
264
-
265
-
266
-
267
-
268
-
269
-
270
-
271
-
272
-
273
-
274
-
275
-
276
-
277
-
278
-
279
-
280
-
281
-
282
-
283
-
284
-
285
-
286
-
287
-
288
-
289
-
290
-
291
-
292
-
293
-
294
-
295
-
296
 |
 |
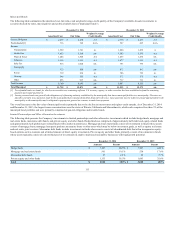
The Company manages the credit risk associated with the European securities within the investment portfolio on an on-going basis using several processes
which are supported by macroeconomic analysis and issuer credit analysis. For additional details regarding the Company’s management of credit risk, see the
Credit Risk section of this MD&A. The Company periodically considers alternate scenarios, including a base-case and both positive and negative “tail”
scenarios that includes a partial or full break-up of the Eurozone. The outlook for key factors is evaluated, including the economic prospects for key
countries, the potential for the spread of sovereign debt contagion, and the likelihood that policymakers and politicians pursue sufficient fiscal discipline
and introduce appropriate backstops. Given the inherent uncertainty in the outcome of developments in the Eurozone, however, the Company has been
focused on controlling both absolute levels of exposure and the composition of that exposure through both bond and derivative transactions.
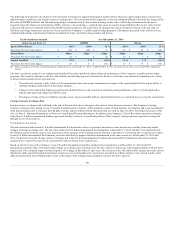
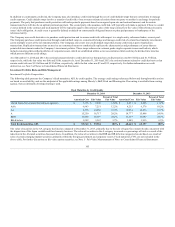
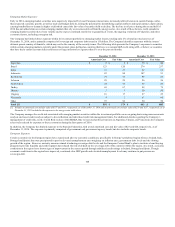
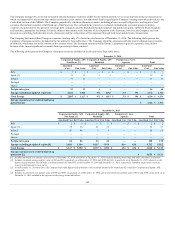
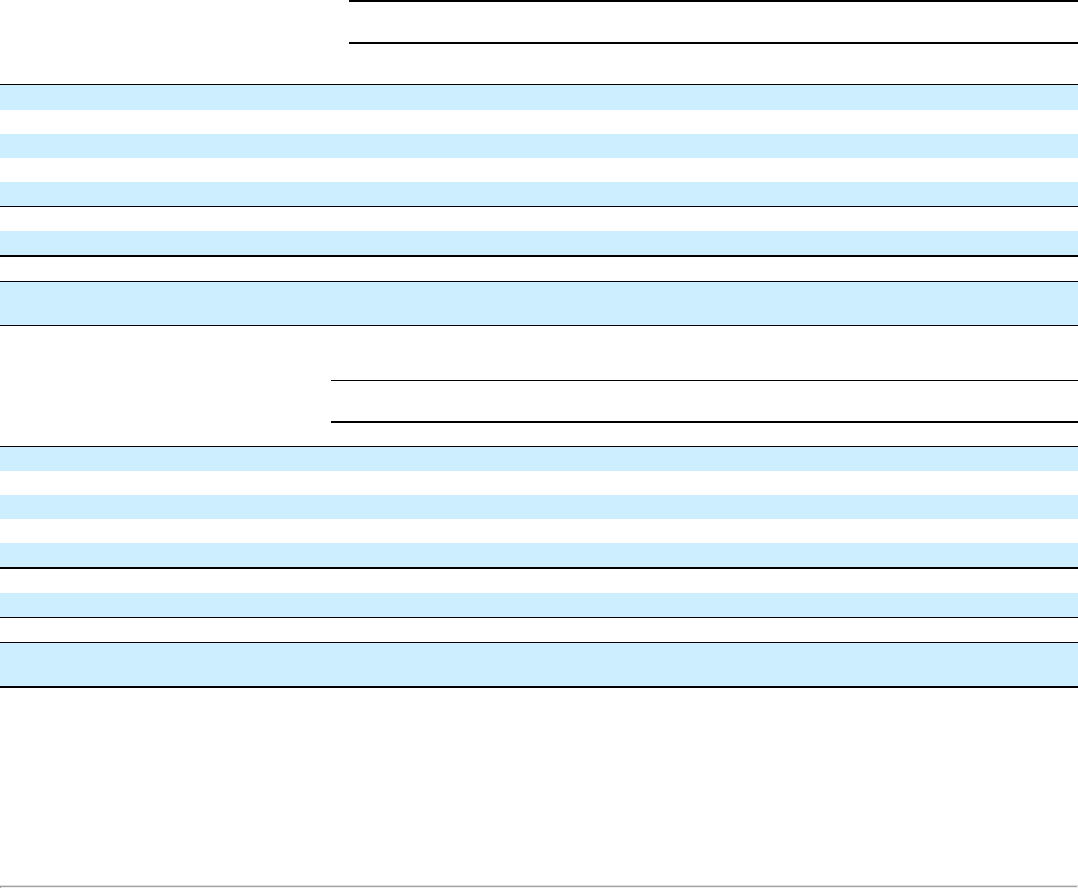
The Company has limited direct European exposure, totaling only 6% of total invested assets as of December 31, 2014. The following tables present the
Company’s European securities included in the Securities by Type table above. The Company identifies exposures with the issuers’ ultimate parent country
of domicile, which may not be the country of the security issuer. The European countries within Europe’s peripheral region are separately listed below
because of the current significant economic strains persisting in these countries.
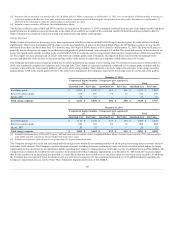
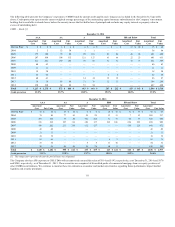
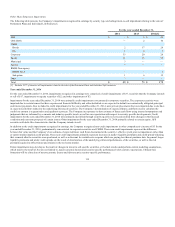
The following tables present the Company’s European securities included in the Securities by Type table above.
Italy $ 1 $ 1 $ — $ — $ — $ — $ 1 $ 1
Spain [3] 21 23 1 1 — — 22 24
Ireland 31 35 — — — — 31 35
Portugal — — — — — — — —
Greece — — — — — — — —
Italy $ 2 $ 2 $ — $ — $ — $ — $ 2 $ 2
Spain [3] 35 36 21 21 — — 56 57
Ireland 47 48 3 3 — — 50 51
Portugal — — — — — — — —
Greece — — — — — — — —
[1] Includes amortized cost and fair value of $4 as of December 31, 2014 and $34 as of December 31, 2013 related to limited partnerships and other alternative investments.
[2] Includes a notional amount and fair value of $44 and $0, respectively, as of December 31, 2014 and $190 and $(1), respectively, as of December 31, 2013 related to credit
default swap protection. This includes a notional amount of $3 and $55 as of December 31, 2014 and December 31, 2013, respectively, related to single name corporate
issuers in the financial services sector.
[3] As of December 31, 2014 and 2013, the Company had credit default swap protection with a notional amount of $3 related and $23 related to Corporate and Equity, AFS,
respectively.
[4] Includes an amortized cost and fair value of $389 and $407, respectively, as of December 31, 2014 and an amortized cost and fair value of $574 and $590, respectively, as of
December 31 2013 included in the exposure to the energy sector table above.
109