The Hartford 2014 Annual Report Download - page 226
Download and view the complete annual report
Please find page 226 of the 2014 The Hartford annual report below. You can navigate through the pages in the report by either clicking on the pages listed below, or by using the keyword search tool below to find specific information within the annual report.-
 1
1 -
2
-
3
-
4
-
5
-
6
-
7
-
8
-
9
-
10
-
11
-
12
-
13
-
14
-
15
-
16
-
17
-
18
-
19
-
20
-
21
-
22
-
23
-
24
-
25
-
26
-
27
-
28
-
29
-
30
-
31
-
32
-
33
-
34
-
35
-
36
-
37
-
38
-
39
-
40
-
41
-
42
-
43
-
44
-
45
-
46
-
47
-
48
-
49
-
50
-
51
-
52
-
53
-
54
-
55
-
56
-
57
-
58
-
59
-
60
-
61
-
62
-
63
-
64
-
65
-
66
-
67
-
68
-
69
-
70
-
71
-
72
-
73
-
74
-
75
-
76
-
77
-
78
-
79
-
80
-
81
-
82
-
83
-
84
-
85
-
86
-
87
-
88
-
89
-
90
-
91
-
92
-
93
-
94
-
95
-
96
-
97
-
98
-
99
-
100
-
101
-
102
-
103
-
104
-
105
-
106
-
107
-
108
-
109
-
110
-
111
-
112
-
113
-
114
-
115
-
116
-
117
-
118
-
119
-
120
-
121
-
122
-
123
-
124
-
125
-
126
-
127
-
128
-
129
-
130
-
131
-
132
-
133
-
134
-
135
-
136
-
137
-
138
-
139
-
140
-
141
-
142
-
143
-
144
-
145
-
146
-
147
-
148
-
149
-
150
-
151
-
152
-
153
-
154
-
155
-
156
-
157
-
158
-
159
-
160
-
161
-
162
-
163
-
164
-
165
-
166
-
167
-
168
-
169
-
170
-
171
-
172
-
173
-
174
-
175
-
176
-
177
-
178
-
179
-
180
-
181
-
182
-
183
-
184
-
185
-
186
-
187
-
188
-
189
-
190
-
191
-
192
-
193
-
194
-
195
-
196
-
197
-
198
-
199
-
200
-
201
-
202
-
203
-
204
-
205
-
206
-
207
-
208
-
209
-
210
-
211
-
212
-
213
-
214
-
215
-
 216
216 -
 217
217 -
 218
218 -
 219
219 -
 220
220 -
 221
221 -
 222
222 -
 223
223 -
 224
224 -
 225
225 -
 226
226 -
 227
227 -
 228
228 -
 229
229 -
 230
230 -
 231
231 -
 232
232 -
 233
233 -
 234
234 -
 235
235 -
 236
236 -
237
-
238
-
239
-
240
-
241
-
242
-
243
-
244
-
245
-
246
-
247
-
248
-
249
-
250
-
251
-
252
-
253
-
254
-
255
-
256
-
257
-
258
-
259
-
260
-
261
-
262
-
263
-
264
-
265
-
266
-
267
-
268
-
269
-
270
-
271
-
272
-
273
-
274
-
275
-
276
-
277
-
278
-
279
-
280
-
281
-
282
-
283
-
284
-
285
-
286
-
287
-
288
-
289
-
290
-
291
-
292
-
293
-
294
-
295
-
296
 |
 |

Table of Contents
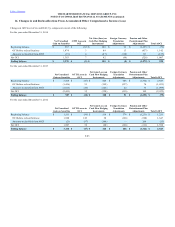
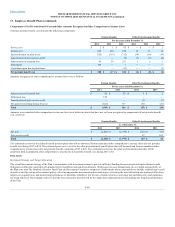
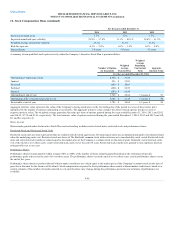
Total net periodic benefit cost includes the following components:
Service cost $ 2 $ 1 $ 92 $ — $ — $ 2
Interest cost 258 238 250 14 11 14
Expected return on plan assets (325) (315) (312) (14) (14) (14)
Amortization of prior service credit — — (9) (7) (7) (4)
Amortization of actuarial loss 45 59 231 5 2 1
Settlements 128 — 1 — — —
Curtailment gain due to plan freeze — — (11) — — (1)
Amounts recognized in other comprehensive income (loss) were as follows:
Amortization of actuarial loss $ 45 $ 59 $ 5 $ 2
Settlement loss 128 — — —
Amortization of prior service credit — — (7) (7)
Net gain (loss) arising during the year (622) 137 (51) (21)
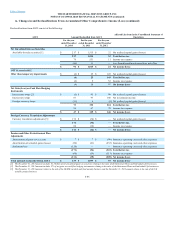
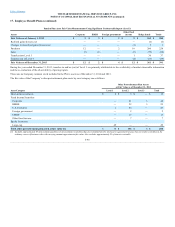
Amounts in accumulated other comprehensive income (loss) on a before tax basis that have not yet been recognized as components of net periodic benefit
cost consist of:
Net loss $ (2,428) $ (1,979) $ (124) $ (77)
Prior service credit — — 97 103
The estimated net loss for the defined benefit pension plans that will be amortized from accumulated other comprehensive income (loss) into net periodic
benefit cost during 2015 is $58. The estimated prior service cost for the other postretirement benefit plans that will be amortized from accumulated other
comprehensive income (loss) into net periodic benefit cost during 2015 is $(7). The estimated net loss for the other postretirement plans that will be
amortized from accumulated other comprehensive income into net periodic benefit cost during 2015 is $5.
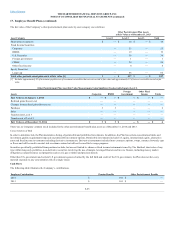
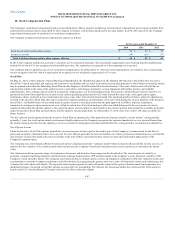
Investment Strategy and Target Allocation
The overall investment strategy of the Plan is to maximize total investment returns to provide sufficient funding for present and anticipated future benefit
obligations within the constraints of a prudent level of portfolio risk and diversification. With respect to asset management, the oversight responsibility of
the Plan rests with The Hartford’s Pension Fund Trust and Investment Committee composed of individuals whose responsibilities include establishing overall
objectives and the setting of investment policy; selecting appropriate investment options and ranges; reviewing the asset allocation mix and asset allocation
targets on a regular basis; and monitoring performance to determine whether or not the rate of return objectives are being met and that policy and guidelines
are being followed. The Company believes that the asset allocation decision will be the single most important factor determining the long-term performance
of the Plan.
F-90