The Hartford 2014 Annual Report Download - page 75
Download and view the complete annual report
Please find page 75 of the 2014 The Hartford annual report below. You can navigate through the pages in the report by either clicking on the pages listed below, or by using the keyword search tool below to find specific information within the annual report.-
 1
1 -
2
-
3
-
4
-
5
-
6
-
7
-
8
-
9
-
10
-
11
-
12
-
13
-
14
-
15
-
16
-
17
-
18
-
19
-
20
-
21
-
22
-
23
-
24
-
25
-
26
-
27
-
28
-
29
-
30
-
31
-
32
-
33
-
34
-
35
-
36
-
37
-
38
-
39
-
40
-
41
-
42
-
43
-
44
-
45
-
46
-
47
-
48
-
49
-
50
-
51
-
52
-
53
-
54
-
55
-
56
-
57
-
58
-
59
-
60
-
61
-
62
-
63
-
64
-
 65
65 -
 66
66 -
 67
67 -
 68
68 -
 69
69 -
 70
70 -
 71
71 -
 72
72 -
 73
73 -
 74
74 -
 75
75 -
 76
76 -
 77
77 -
 78
78 -
 79
79 -
 80
80 -
 81
81 -
 82
82 -
 83
83 -
 84
84 -
 85
85 -
86
-
87
-
88
-
89
-
90
-
91
-
92
-
93
-
94
-
95
-
96
-
97
-
98
-
99
-
100
-
101
-
102
-
103
-
104
-
105
-
106
-
107
-
108
-
109
-
110
-
111
-
112
-
113
-
114
-
115
-
116
-
117
-
118
-
119
-
120
-
121
-
122
-
123
-
124
-
125
-
126
-
127
-
128
-
129
-
130
-
131
-
132
-
133
-
134
-
135
-
136
-
137
-
138
-
139
-
140
-
141
-
142
-
143
-
144
-
145
-
146
-
147
-
148
-
149
-
150
-
151
-
152
-
153
-
154
-
155
-
156
-
157
-
158
-
159
-
160
-
161
-
162
-
163
-
164
-
165
-
166
-
167
-
168
-
169
-
170
-
171
-
172
-
173
-
174
-
175
-
176
-
177
-
178
-
179
-
180
-
181
-
182
-
183
-
184
-
185
-
186
-
187
-
188
-
189
-
190
-
191
-
192
-
193
-
194
-
195
-
196
-
197
-
198
-
199
-
200
-
201
-
202
-
203
-
204
-
205
-
206
-
207
-
208
-
209
-
210
-
211
-
212
-
213
-
214
-
215
-
216
-
217
-
218
-
219
-
220
-
221
-
222
-
223
-
224
-
225
-
226
-
227
-
228
-
229
-
230
-
231
-
232
-
233
-
234
-
235
-
236
-
237
-
238
-
239
-
240
-
241
-
242
-
243
-
244
-
245
-
246
-
247
-
248
-
249
-
250
-
251
-
252
-
253
-
254
-
255
-
256
-
257
-
258
-
259
-
260
-
261
-
262
-
263
-
264
-
265
-
266
-
267
-
268
-
269
-
270
-
271
-
272
-
273
-
274
-
275
-
276
-
277
-
278
-
279
-
280
-
281
-
282
-
283
-
284
-
285
-
286
-
287
-
288
-
289
-
290
-
291
-
292
-
293
-
294
-
295
-
296
 |
 |

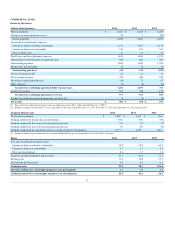
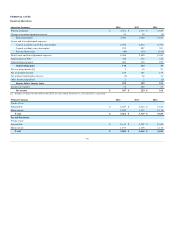
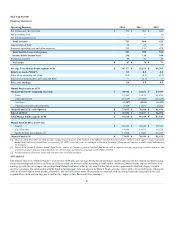
Automobile 2,049 2,019 2,015
Homeowners 1,309 1,319 1,319
Automobile $ 415 $ 374 $ 332
Homeowners $ 130 $ 131 $ 117
Automobile 85% 86% 85%
Homeowners 86% 87% 86%
Automobile 5% 5% 3%
Homeowners 8% 7% 6%
Automobile 5% 5% 6%
Homeowners 8% 6% 7%
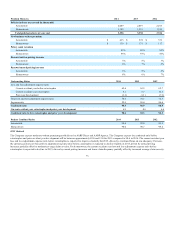
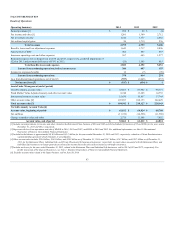
Loss and loss adjustment expense ratio
Current accident year before catastrophes 65.6 65.9 65.7
Current accident year catastrophes 6.1 5.7 10.5
Prior year development (1.2) (1.1) (3.9)
Total loss and loss adjustment expense ratio 70.5 70.5 72.3
Expense ratio 25.0 26.4 26.6
4.9 4.6 6.6
Automobile 98.4 99.0 99.1
Homeowners 90.0 90.7 98.2
2015 Outlook
The Company expects moderate written premium growth driven by AARP Direct and AARP Agency. The Company expects the combined ratio before
catastrophes and prior accident year development will be between approximately 89.0 and 91.0 for 2015 compared to 90.6 in 2014. The current accident year
loss and loss adjustment expense ratio before catastrophes is expected to improve modestly for 2015, driven by continued focus on rate adequacy. For auto,
the current accident year loss and loss adjustment expense ratio before catastrophes is expected to decline slightly in 2015, driven by earned pricing
increases partially offset by moderate average claim severity. For homeowners, the current accident year loss and loss adjustment expense ratio before
catastrophes is expected to decline in 2015, driven by earned pricing increases and lower claim frequency partially offset by increased average claim severity.
75