The Hartford 2014 Annual Report Download - page 40
Download and view the complete annual report
Please find page 40 of the 2014 The Hartford annual report below. You can navigate through the pages in the report by either clicking on the pages listed below, or by using the keyword search tool below to find specific information within the annual report.-
 1
1 -
2
-
3
-
4
-
5
-
6
-
7
-
8
-
9
-
10
-
11
-
12
-
13
-
14
-
15
-
16
-
17
-
18
-
19
-
20
-
21
-
22
-
23
-
24
-
25
-
26
-
27
-
28
-
29
-
 30
30 -
 31
31 -
 32
32 -
 33
33 -
 34
34 -
 35
35 -
 36
36 -
 37
37 -
 38
38 -
 39
39 -
 40
40 -
 41
41 -
 42
42 -
 43
43 -
 44
44 -
 45
45 -
 46
46 -
 47
47 -
 48
48 -
 49
49 -
 50
50 -
51
-
52
-
53
-
54
-
55
-
56
-
57
-
58
-
59
-
60
-
61
-
62
-
63
-
64
-
65
-
66
-
67
-
68
-
69
-
70
-
71
-
72
-
73
-
74
-
75
-
76
-
77
-
78
-
79
-
80
-
81
-
82
-
83
-
84
-
85
-
86
-
87
-
88
-
89
-
90
-
91
-
92
-
93
-
94
-
95
-
96
-
97
-
98
-
99
-
100
-
101
-
102
-
103
-
104
-
105
-
106
-
107
-
108
-
109
-
110
-
111
-
112
-
113
-
114
-
115
-
116
-
117
-
118
-
119
-
120
-
121
-
122
-
123
-
124
-
125
-
126
-
127
-
128
-
129
-
130
-
131
-
132
-
133
-
134
-
135
-
136
-
137
-
138
-
139
-
140
-
141
-
142
-
143
-
144
-
145
-
146
-
147
-
148
-
149
-
150
-
151
-
152
-
153
-
154
-
155
-
156
-
157
-
158
-
159
-
160
-
161
-
162
-
163
-
164
-
165
-
166
-
167
-
168
-
169
-
170
-
171
-
172
-
173
-
174
-
175
-
176
-
177
-
178
-
179
-
180
-
181
-
182
-
183
-
184
-
185
-
186
-
187
-
188
-
189
-
190
-
191
-
192
-
193
-
194
-
195
-
196
-
197
-
198
-
199
-
200
-
201
-
202
-
203
-
204
-
205
-
206
-
207
-
208
-
209
-
210
-
211
-
212
-
213
-
214
-
215
-
216
-
217
-
218
-
219
-
220
-
221
-
222
-
223
-
224
-
225
-
226
-
227
-
228
-
229
-
230
-
231
-
232
-
233
-
234
-
235
-
236
-
237
-
238
-
239
-
240
-
241
-
242
-
243
-
244
-
245
-
246
-
247
-
248
-
249
-
250
-
251
-
252
-
253
-
254
-
255
-
256
-
257
-
258
-
259
-
260
-
261
-
262
-
263
-
264
-
265
-
266
-
267
-
268
-
269
-
270
-
271
-
272
-
273
-
274
-
275
-
276
-
277
-
278
-
279
-
280
-
281
-
282
-
283
-
284
-
285
-
286
-
287
-
288
-
289
-
290
-
291
-
292
-
293
-
294
-
295
-
296
 |
 |

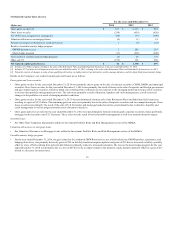
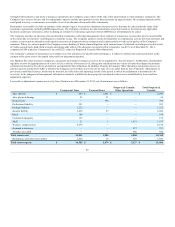
• For the year ended December 31, 2013 the gain on GMWB related derivatives, net, was primarily related to gains of $203 from revaluing the liability for
living benefits largely driven by favorable policyholder behavior related to increased surrenders and gains of $38 due to liability assumption updates for
lapses and withdrawal rates. The loss on the macro hedge program for the year ended December 31, 2013 was primarily driven by losses of $114 due to
an improvement in domestic equity markets, losses of $56 related to an increase in interest rates, and losses of $31 related to a decrease in equity market
volatility.
• For the year ended December 31, 2012 the gain on GMWB related derivatives, net, was primarily driven by gains due to liability model assumption
updates of $274, largely related to a reduction in the reset assumptions to better align with actual experience, gains of $106 related to outperformance of
the underlying actively managed funds compared to their respective indices, and gains of $83 driven by a decline in equity market volatility. The loss
on the macro hedge program for the year ended December 31, 2013 was primarily driven by losses of $167 related to the passage of time, losses of $118
due to an improvement in domestic equity markets, and losses of $60 related to a decrease in equity market volatility.
Other, net
• Other, net loss for the year ended December 31, 2014 was primarily related to a loss of $172 on interest rate derivatives used to manage the risk of a rise
in interest rates and manage duration, driven by a decline in U.S. interest rates.
• Other, net gain for the year ended December 31, 2013 was primarily related to gains of $71 on interest rate derivatives primarily associated with fixed
rate bonds sold as part of the Individual Life and Retirement Plan business dispositions. For further information on the business dispositions, see Note 2
of Notes to the Consolidated Financial Statements. Additional gains included $69 on interest rate derivatives primarily due to an increase in U.S. interest
rates and $42 of gains on credit derivatives due to credit spreads tightening.
• Other, net gain for the year ended December 31, 2012 was primarily related to gains of $313 on credit derivatives due to credit spreads tightening, and
gains of $96 on interest derivatives largely driven by the de-designation of the cash flow hedges associated with bonds included in the sale of Individual
Life and Retirement Plans businesses. For further information on the business dispositions, see Note 2 of Notes to the Consolidated Financial Statements.
These gains were partially offset by losses of $111 related to Japan fixed payout annuity hedges primarily driven by the strengthening of the currency
basis swap spread between the U.S. dollar and Japanese yen and the decline in U.S. interest rates.
40