The Hartford 2014 Annual Report Download - page 37
Download and view the complete annual report
Please find page 37 of the 2014 The Hartford annual report below. You can navigate through the pages in the report by either clicking on the pages listed below, or by using the keyword search tool below to find specific information within the annual report.-
 1
1 -
2
-
3
-
4
-
5
-
6
-
7
-
8
-
9
-
10
-
11
-
12
-
13
-
14
-
15
-
16
-
17
-
18
-
19
-
20
-
21
-
22
-
23
-
24
-
25
-
26
-
 27
27 -
 28
28 -
 29
29 -
 30
30 -
 31
31 -
 32
32 -
 33
33 -
 34
34 -
 35
35 -
 36
36 -
 37
37 -
 38
38 -
 39
39 -
 40
40 -
 41
41 -
 42
42 -
 43
43 -
 44
44 -
 45
45 -
 46
46 -
 47
47 -
48
-
49
-
50
-
51
-
52
-
53
-
54
-
55
-
56
-
57
-
58
-
59
-
60
-
61
-
62
-
63
-
64
-
65
-
66
-
67
-
68
-
69
-
70
-
71
-
72
-
73
-
74
-
75
-
76
-
77
-
78
-
79
-
80
-
81
-
82
-
83
-
84
-
85
-
86
-
87
-
88
-
89
-
90
-
91
-
92
-
93
-
94
-
95
-
96
-
97
-
98
-
99
-
100
-
101
-
102
-
103
-
104
-
105
-
106
-
107
-
108
-
109
-
110
-
111
-
112
-
113
-
114
-
115
-
116
-
117
-
118
-
119
-
120
-
121
-
122
-
123
-
124
-
125
-
126
-
127
-
128
-
129
-
130
-
131
-
132
-
133
-
134
-
135
-
136
-
137
-
138
-
139
-
140
-
141
-
142
-
143
-
144
-
145
-
146
-
147
-
148
-
149
-
150
-
151
-
152
-
153
-
154
-
155
-
156
-
157
-
158
-
159
-
160
-
161
-
162
-
163
-
164
-
165
-
166
-
167
-
168
-
169
-
170
-
171
-
172
-
173
-
174
-
175
-
176
-
177
-
178
-
179
-
180
-
181
-
182
-
183
-
184
-
185
-
186
-
187
-
188
-
189
-
190
-
191
-
192
-
193
-
194
-
195
-
196
-
197
-
198
-
199
-
200
-
201
-
202
-
203
-
204
-
205
-
206
-
207
-
208
-
209
-
210
-
211
-
212
-
213
-
214
-
215
-
216
-
217
-
218
-
219
-
220
-
221
-
222
-
223
-
224
-
225
-
226
-
227
-
228
-
229
-
230
-
231
-
232
-
233
-
234
-
235
-
236
-
237
-
238
-
239
-
240
-
241
-
242
-
243
-
244
-
245
-
246
-
247
-
248
-
249
-
250
-
251
-
252
-
253
-
254
-
255
-
256
-
257
-
258
-
259
-
260
-
261
-
262
-
263
-
264
-
265
-
266
-
267
-
268
-
269
-
270
-
271
-
272
-
273
-
274
-
275
-
276
-
277
-
278
-
279
-
280
-
281
-
282
-
283
-
284
-
285
-
286
-
287
-
288
-
289
-
290
-
291
-
292
-
293
-
294
-
295
-
296
 |
 |
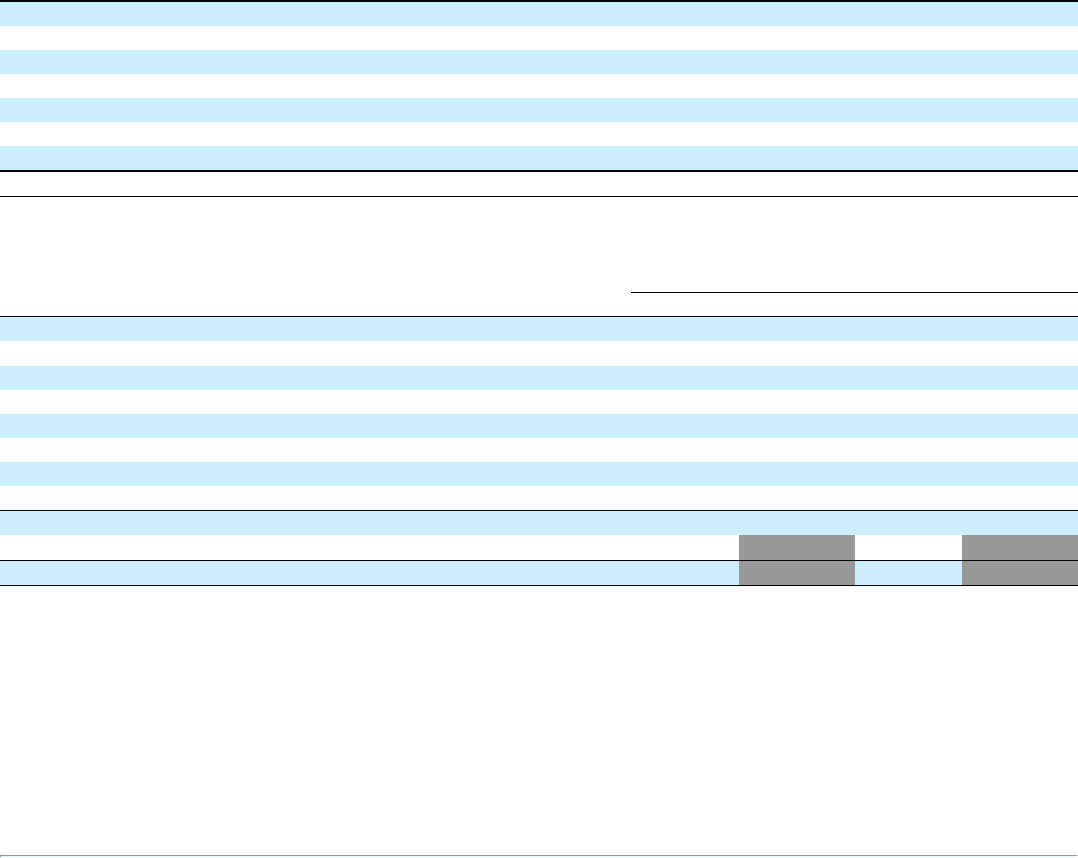
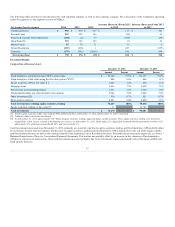
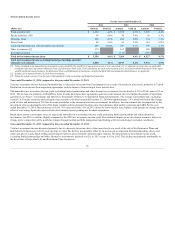
The following table presents net income (loss) for each reporting segment, as well as the Corporate category. For a discussion of the Company's operating
results by segment, see the segment sections of MD&A.
Net income (loss) by segment
Commercial Lines $ 870 $ 547 $ 113 $ 323
Personal Lines 229 166 (22) 63
Property & Casualty Other Operations (2) 57 (106) (59)
Group Benefits 192 129 (1) 63
Mutual Funds 76 71 11 5
Talcott Resolution (634) 1 447 (635)
Corporate (555) (1,009) 180 454
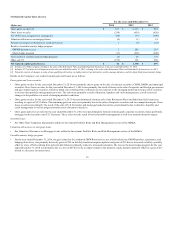
Composition of Invested Assets
Fixed maturities, available-for-sale ("AFS"), at fair value $ 59,384 77.9% $ 62,357 79.2%
Fixed maturities, at fair value using the fair value option ("FVO") 488 0.6% 844 1.1%
Equity securities, AFS, at fair value [1] 1,047 1.4% 868 1.1%
Mortgage loans 5,556 7.3% 5,598 7.1%
Policy loans, at outstanding balance 1,431 1.9% 1,420 1.8%
Limited partnerships and other alternative investments 2,942 3.9% 3,040 3.9%
Other investments [2] 536 0.7% 521 0.7%
Short-term investments 4,883 6.4% 4,008 5.1%
Equity securities, trading, at fair value [3] 11 19,745
[1] Includes equity securities at fair value using the FVO of $348 and $0 as of December 31, 2014 and December 31, 2013, respectively.
[2] Primarily relates to derivative instruments.
[3] As of December 31, 2013, approximately $19.7 billion of equity securities, trading, supported Japan variable annuities. Those equity securities, trading, were invested in
mutual funds, which, in turn, invested in the following asset classes as of December 31, 2013: Japan equity 22%, Japan fixed income (primarily government securities) 15%,
global equity 22%, global government bonds 40%, and cash and other 1%.
Total investments decreased since December 31, 2013, primarily as a result of a decline in equity securities, trading and fixed maturities, AFS, partially offset
by an increase in short-term investments. The decrease in equity securities, trading and fixed maturities, AFS is largely due to the sale of the Japan variable
and fixed annuity business as well as the continued runoff of the remaining Talcott Resolution business. For further discussion on the Japan sale, see Note 2 -
Business Dispositions of Notes to Consolidated Financial Statements. This decline was partially offset by an increase in the valuation of fixed maturities,
AFS due to a decrease in interest rates. Short-term investments increased primarily due to the investment of proceeds from the sale of the Japan variable and
fixed annuity business.
37