The Hartford 2014 Annual Report Download - page 224
Download and view the complete annual report
Please find page 224 of the 2014 The Hartford annual report below. You can navigate through the pages in the report by either clicking on the pages listed below, or by using the keyword search tool below to find specific information within the annual report.-
 1
1 -
2
-
3
-
4
-
5
-
6
-
7
-
8
-
9
-
10
-
11
-
12
-
13
-
14
-
15
-
16
-
17
-
18
-
19
-
20
-
21
-
22
-
23
-
24
-
25
-
26
-
27
-
28
-
29
-
30
-
31
-
32
-
33
-
34
-
35
-
36
-
37
-
38
-
39
-
40
-
41
-
42
-
43
-
44
-
45
-
46
-
47
-
48
-
49
-
50
-
51
-
52
-
53
-
54
-
55
-
56
-
57
-
58
-
59
-
60
-
61
-
62
-
63
-
64
-
65
-
66
-
67
-
68
-
69
-
70
-
71
-
72
-
73
-
74
-
75
-
76
-
77
-
78
-
79
-
80
-
81
-
82
-
83
-
84
-
85
-
86
-
87
-
88
-
89
-
90
-
91
-
92
-
93
-
94
-
95
-
96
-
97
-
98
-
99
-
100
-
101
-
102
-
103
-
104
-
105
-
106
-
107
-
108
-
109
-
110
-
111
-
112
-
113
-
114
-
115
-
116
-
117
-
118
-
119
-
120
-
121
-
122
-
123
-
124
-
125
-
126
-
127
-
128
-
129
-
130
-
131
-
132
-
133
-
134
-
135
-
136
-
137
-
138
-
139
-
140
-
141
-
142
-
143
-
144
-
145
-
146
-
147
-
148
-
149
-
150
-
151
-
152
-
153
-
154
-
155
-
156
-
157
-
158
-
159
-
160
-
161
-
162
-
163
-
164
-
165
-
166
-
167
-
168
-
169
-
170
-
171
-
172
-
173
-
174
-
175
-
176
-
177
-
178
-
179
-
180
-
181
-
182
-
183
-
184
-
185
-
186
-
187
-
188
-
189
-
190
-
191
-
192
-
193
-
194
-
195
-
196
-
197
-
198
-
199
-
200
-
201
-
202
-
203
-
204
-
205
-
206
-
207
-
208
-
209
-
210
-
211
-
212
-
213
-
 214
214 -
 215
215 -
 216
216 -
 217
217 -
 218
218 -
 219
219 -
 220
220 -
 221
221 -
 222
222 -
 223
223 -
 224
224 -
 225
225 -
 226
226 -
 227
227 -
 228
228 -
 229
229 -
 230
230 -
 231
231 -
 232
232 -
 233
233 -
 234
234 -
235
-
236
-
237
-
238
-
239
-
240
-
241
-
242
-
243
-
244
-
245
-
246
-
247
-
248
-
249
-
250
-
251
-
252
-
253
-
254
-
255
-
256
-
257
-
258
-
259
-
260
-
261
-
262
-
263
-
264
-
265
-
266
-
267
-
268
-
269
-
270
-
271
-
272
-
273
-
274
-
275
-
276
-
277
-
278
-
279
-
280
-
281
-
282
-
283
-
284
-
285
-
286
-
287
-
288
-
289
-
290
-
291
-
292
-
293
-
294
-
295
-
296
 |
 |

Table of Contents
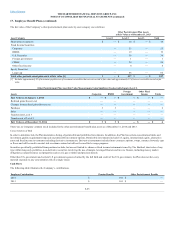
Weighted average assumptions used in calculating the net periodic benefit cost for the Company’s other postretirement plans were as follows:
Discount rate 4.25% 3.50% 4.00%
Expected long-term rate of return on plan assets 7.10% 7.10% 7.30%
Assumed health care cost trend rates were as follows:
Pre-65 health care cost trend rate 7.70% 8.05% 8.45%
Post-65 health care cost trend rate 5.60% 5.70% 6.15%
Rate to which the cost trend rate is assumed to decline (the ultimate trend rate) 5.00% 5.00% 4.75%
Year that the rate reaches the ultimate trend rate 2023 2021 2020
A one-percentage point change in assumed health care cost trend rates would have an insignificant effect on the amounts reported for other postretirement
plans.
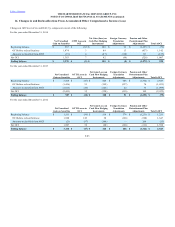
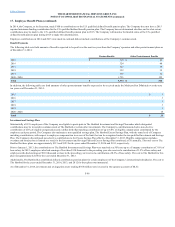
The following tables set forth a reconciliation of beginning and ending balances of the benefit obligation and fair value of plan assets,
as well as the funded status of the Company's defined benefit pension and postretirement health care and life insurance benefit plans. International plans
represent an immaterial percentage of total pension assets, liabilities and expense and, for reporting purposes, are combined with domestic plans.
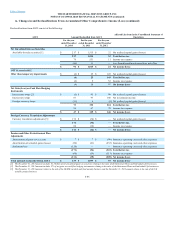
Service cost (excluding expenses) 2 1 — —
Interest cost 258 238 14 11
Plan participants’ contributions — — 26 24
Actuarial loss (gain) (8) 14 38 39
Settlements (319) — — —
Change in assumptions 846 (508) 16 (19)
Benefits paid (268) (308) (70) (58)
Retiree drug subsidy — — 2 2
Foreign exchange adjustment (2) (1) — —
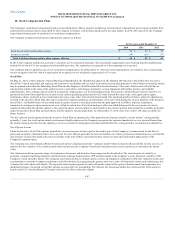
Settlements in 2014 were primarily the result of the Company's extension of a limited time voluntary lump sum offer to approximately 13,500 vested
participants in the U.S. qualified defined benefit pension plan who had separated from service, but who had not yet commenced annuity benefits. The
Company made lump sum benefit payments totaling $274 to approximately 5,600 vested participants. The Company also made lump sum payments of $45
to eligible cash balance participants independent of the voluntary lump sum offer.
Changes in assumptions in 2014 include an increase of $279 related to the Company's use of updated mortality rates reflecting improved life expectancy and
an increase of $567 related to a reduction in the discount rate.
F-88