The Hartford 2014 Annual Report Download - page 186
Download and view the complete annual report
Please find page 186 of the 2014 The Hartford annual report below. You can navigate through the pages in the report by either clicking on the pages listed below, or by using the keyword search tool below to find specific information within the annual report.-
 1
1 -
2
-
3
-
4
-
5
-
6
-
7
-
8
-
9
-
10
-
11
-
12
-
13
-
14
-
15
-
16
-
17
-
18
-
19
-
20
-
21
-
22
-
23
-
24
-
25
-
26
-
27
-
28
-
29
-
30
-
31
-
32
-
33
-
34
-
35
-
36
-
37
-
38
-
39
-
40
-
41
-
42
-
43
-
44
-
45
-
46
-
47
-
48
-
49
-
50
-
51
-
52
-
53
-
54
-
55
-
56
-
57
-
58
-
59
-
60
-
61
-
62
-
63
-
64
-
65
-
66
-
67
-
68
-
69
-
70
-
71
-
72
-
73
-
74
-
75
-
76
-
77
-
78
-
79
-
80
-
81
-
82
-
83
-
84
-
85
-
86
-
87
-
88
-
89
-
90
-
91
-
92
-
93
-
94
-
95
-
96
-
97
-
98
-
99
-
100
-
101
-
102
-
103
-
104
-
105
-
106
-
107
-
108
-
109
-
110
-
111
-
112
-
113
-
114
-
115
-
116
-
117
-
118
-
119
-
120
-
121
-
122
-
123
-
124
-
125
-
126
-
127
-
128
-
129
-
130
-
131
-
132
-
133
-
134
-
135
-
136
-
137
-
138
-
139
-
140
-
141
-
142
-
143
-
144
-
145
-
146
-
147
-
148
-
149
-
150
-
151
-
152
-
153
-
154
-
155
-
156
-
157
-
158
-
159
-
160
-
161
-
162
-
163
-
164
-
165
-
166
-
167
-
168
-
169
-
170
-
171
-
172
-
173
-
174
-
175
-
 176
176 -
 177
177 -
 178
178 -
 179
179 -
 180
180 -
 181
181 -
 182
182 -
 183
183 -
 184
184 -
 185
185 -
 186
186 -
 187
187 -
 188
188 -
 189
189 -
 190
190 -
 191
191 -
 192
192 -
 193
193 -
 194
194 -
 195
195 -
 196
196 -
197
-
198
-
199
-
200
-
201
-
202
-
203
-
204
-
205
-
206
-
207
-
208
-
209
-
210
-
211
-
212
-
213
-
214
-
215
-
216
-
217
-
218
-
219
-
220
-
221
-
222
-
223
-
224
-
225
-
226
-
227
-
228
-
229
-
230
-
231
-
232
-
233
-
234
-
235
-
236
-
237
-
238
-
239
-
240
-
241
-
242
-
243
-
244
-
245
-
246
-
247
-
248
-
249
-
250
-
251
-
252
-
253
-
254
-
255
-
256
-
257
-
258
-
259
-
260
-
261
-
262
-
263
-
264
-
265
-
266
-
267
-
268
-
269
-
270
-
271
-
272
-
273
-
274
-
275
-
276
-
277
-
278
-
279
-
280
-
281
-
282
-
283
-
284
-
285
-
286
-
287
-
288
-
289
-
290
-
291
-
292
-
293
-
294
-
295
-
296
 |
 |

Table of Contents
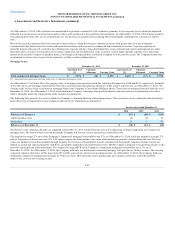
The Company performs ongoing qualitative assessments of its VIEs to determine whether the Company has a controlling financial interest in the VIE and
therefore is the primary beneficiary. The Company is deemed to have a controlling financial interest when it has both the ability to direct the activities that
most significantly impact the economic performance of the VIE and the obligation to absorb losses or right to receive benefits from the VIE that could
potentially be significant to the VIE. Based on the Company’s assessment, if it determines it is the primary beneficiary, the Company consolidates the VIE in
the Company’s Consolidated Financial Statements.
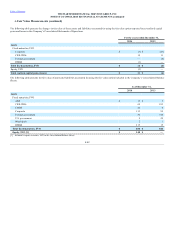
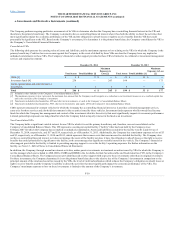
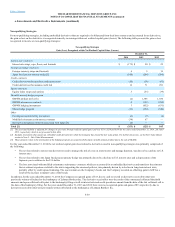
Consolidated VIEs
The following table presents the carrying value of assets and liabilities, and the maximum exposure to loss relating to the VIEs for which the Company is the
primary beneficiary. Creditors have no recourse against the Company in the event of default by these VIEs nor does the Company have any implied or
unfunded commitments to these VIEs. The Company’s financial or other support provided to these VIEs is limited to its collateral or investment management
services and original investment.
CDOs [3] $ 5 $ 5 $ —
$ 31 $ 33 $ —
Investment funds [4] 238 — 243
164 — 173
Limited partnerships and other alternative
investments 3 1 2
4 — 4
[1] Included in other liabilities in the Company’s Consolidated Balance Sheets.
[2] The maximum exposure to loss represents the maximum loss amount that the Company could recognize as a reduction in net investment income or as a realized capital loss
and is the cost basis of the Company’s investment.
[3] Total assets included in fixed maturities, AFS and short-term investments, or cash in the Company’s Consolidated Balance Sheets.
[4] Total assets included in fixed maturities, FVO, short-term investments, and equity, AFS in the Company's Consolidated Balance Sheets.
CDOs represent structured investment vehicles for which the Company has a controlling financial interest as it provides collateral management services,
earns a fee for those services and also holds investments in the securities issued by these vehicles. Investment funds represent wholly-owned fixed income
funds for which the Company has management and control of the investments which is the activity that most significantly impacts its economic performance.
Limited partnerships represent one hedge fund for which the Company holds a majority interest in the fund as an investment.
Non-Consolidated VIEs
The Company holds a significant variable interest for one VIE for which it is not the primary beneficiary and, therefore, was not consolidated on the
Company’s Consolidated Balance Sheets. This VIE represents a contingent capital facility (“facility”) that has been held by the Company since
February 2007 for which the Company has no implied or unfunded commitments. Assets and liabilities recorded for the facility were $12 and $14 as of
December 31, 2014, respectively, and $17 and $19, respectively, as of December 31, 2013. Additionally, the Company has a maximum exposure to loss of $3
and $3, respectively, as of December 31, 2014 and 2013, which represents the issuance costs that were incurred to establish the facility. The Company does
not have a controlling financial interest as it does not manage the assets of the facility nor does it have the obligation to absorb losses or the right to receive
benefits that could potentially be significant to the facility, as the asset manager has significant variable interest in the vehicle. The Company’s financial or
other support provided to the facility is limited to providing ongoing support to cover the facility’s operating expenses. For further information on the
facility, see Note 12 - Debt of Notes to Consolidated Financial Statements.
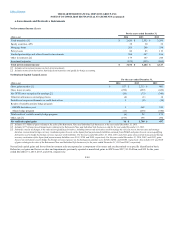
In addition, the Company, through normal investment activities, makes passive investments in structured securities issued by VIEs for which the Company is
not the manager which are included in ABS, CDOs, CMBS and RMBS in the Available-for-Sale Securities table and fixed maturities, FVO, in the Company’s
Consolidated Balance Sheets. The Company has not provided financial or other support with respect to these investments other than its original investment.
For these investments, the Company determined it is not the primary beneficiary due to the relative size of the Company’s investment in comparison to the
principal amount of the structured securities issued by the VIEs, the level of credit subordination which reduces the Company’s obligation to absorb losses or
right to receive benefits and the Company’s inability to direct the activities that most significantly impact the economic performance of the VIEs. The
Company’s maximum exposure to loss on these investments is limited to the amount of the Company’s investment.
F-50