The Hartford 2014 Annual Report Download - page 222
Download and view the complete annual report
Please find page 222 of the 2014 The Hartford annual report below. You can navigate through the pages in the report by either clicking on the pages listed below, or by using the keyword search tool below to find specific information within the annual report.-
 1
1 -
2
-
3
-
4
-
5
-
6
-
7
-
8
-
9
-
10
-
11
-
12
-
13
-
14
-
15
-
16
-
17
-
18
-
19
-
20
-
21
-
22
-
23
-
24
-
25
-
26
-
27
-
28
-
29
-
30
-
31
-
32
-
33
-
34
-
35
-
36
-
37
-
38
-
39
-
40
-
41
-
42
-
43
-
44
-
45
-
46
-
47
-
48
-
49
-
50
-
51
-
52
-
53
-
54
-
55
-
56
-
57
-
58
-
59
-
60
-
61
-
62
-
63
-
64
-
65
-
66
-
67
-
68
-
69
-
70
-
71
-
72
-
73
-
74
-
75
-
76
-
77
-
78
-
79
-
80
-
81
-
82
-
83
-
84
-
85
-
86
-
87
-
88
-
89
-
90
-
91
-
92
-
93
-
94
-
95
-
96
-
97
-
98
-
99
-
100
-
101
-
102
-
103
-
104
-
105
-
106
-
107
-
108
-
109
-
110
-
111
-
112
-
113
-
114
-
115
-
116
-
117
-
118
-
119
-
120
-
121
-
122
-
123
-
124
-
125
-
126
-
127
-
128
-
129
-
130
-
131
-
132
-
133
-
134
-
135
-
136
-
137
-
138
-
139
-
140
-
141
-
142
-
143
-
144
-
145
-
146
-
147
-
148
-
149
-
150
-
151
-
152
-
153
-
154
-
155
-
156
-
157
-
158
-
159
-
160
-
161
-
162
-
163
-
164
-
165
-
166
-
167
-
168
-
169
-
170
-
171
-
172
-
173
-
174
-
175
-
176
-
177
-
178
-
179
-
180
-
181
-
182
-
183
-
184
-
185
-
186
-
187
-
188
-
189
-
190
-
191
-
192
-
193
-
194
-
195
-
196
-
197
-
198
-
199
-
200
-
201
-
202
-
203
-
204
-
205
-
206
-
207
-
208
-
209
-
210
-
211
-
 212
212 -
 213
213 -
 214
214 -
 215
215 -
 216
216 -
 217
217 -
 218
218 -
 219
219 -
 220
220 -
 221
221 -
 222
222 -
 223
223 -
 224
224 -
 225
225 -
 226
226 -
 227
227 -
 228
228 -
 229
229 -
 230
230 -
 231
231 -
 232
232 -
233
-
234
-
235
-
236
-
237
-
238
-
239
-
240
-
241
-
242
-
243
-
244
-
245
-
246
-
247
-
248
-
249
-
250
-
251
-
252
-
253
-
254
-
255
-
256
-
257
-
258
-
259
-
260
-
261
-
262
-
263
-
264
-
265
-
266
-
267
-
268
-
269
-
270
-
271
-
272
-
273
-
274
-
275
-
276
-
277
-
278
-
279
-
280
-
281
-
282
-
283
-
284
-
285
-
286
-
287
-
288
-
289
-
290
-
291
-
292
-
293
-
294
-
295
-
296
 |
 |
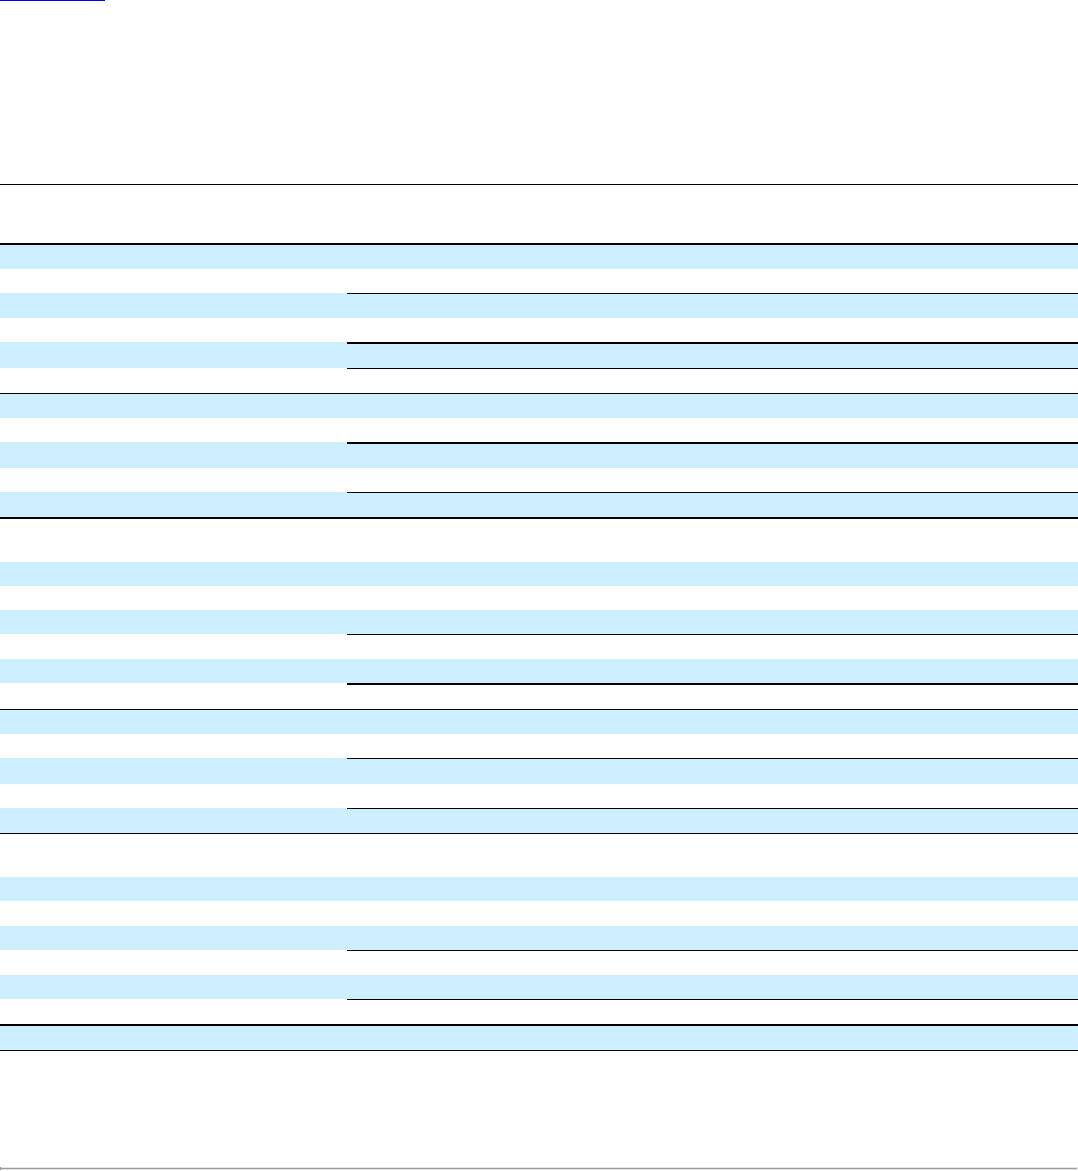
Table of Contents
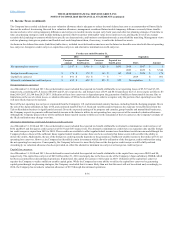
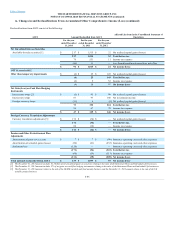
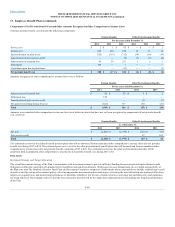
Reclassifications from AOCI consist of the following:
Available-for-sale securities [1] $ 217 $ 1,515 $ 32 Net realized capital gains (losses)
76 531 11 Income tax expense
(50) 31 — Loss from discontinued operations, net of tax
$ (6) $ 25 $ 149 Net realized capital gains (losses)
(2) 9 52 Income tax expense
(4) 16 97
Interest rate swaps [2] $ (1) $ 91 $ 90 Net realized capital gains (losses)
Interest rate swaps 87 97 140 Net investment income
Foreign currency swaps (13) 4 (6) Net realized capital gains (losses)
26 67 78 Income tax expense
Currency translation adjustments [3] $ 172 $ (34) $ — Net realized capital gains (losses)
60 (12) — Income tax expense
Amortization of prior service costs $ 7 $ 7 $ (90) Insurance operating costs and other expenses
Amortization of actuarial gains (losses) (50) (61) (232) Insurance operating costs and other expenses
Settlement loss (128) — — Insurance operating costs and other expenses
(60) (19) (113) Income tax expense
[1] The December 31, 2013 amount includes $1.5 billion of net unrealized gains on securities relating to the sales of the Retirement Plans and Individual Life businesses.
[2] The December 31, 2013 amount includes $71 of net gains on cash flow hedging instruments relating to the sales of the Retirement Plans and Individual Life businesses.
[3] The December 31, 2014 amount relates to the sale of the HLIKK variable and fixed annuity business and the December 31, 2013 amount relates to the sale of the UK
variable annuity business.
F-86