The Hartford 2014 Annual Report Download - page 77
Download and view the complete annual report
Please find page 77 of the 2014 The Hartford annual report below. You can navigate through the pages in the report by either clicking on the pages listed below, or by using the keyword search tool below to find specific information within the annual report.-
 1
1 -
2
-
3
-
4
-
5
-
6
-
7
-
8
-
9
-
10
-
11
-
12
-
13
-
14
-
15
-
16
-
17
-
18
-
19
-
20
-
21
-
22
-
23
-
24
-
25
-
26
-
27
-
28
-
29
-
30
-
31
-
32
-
33
-
34
-
35
-
36
-
37
-
38
-
39
-
40
-
41
-
42
-
43
-
44
-
45
-
46
-
47
-
48
-
49
-
50
-
51
-
52
-
53
-
54
-
55
-
56
-
57
-
58
-
59
-
60
-
61
-
62
-
63
-
64
-
65
-
66
-
 67
67 -
 68
68 -
 69
69 -
 70
70 -
 71
71 -
 72
72 -
 73
73 -
 74
74 -
 75
75 -
 76
76 -
 77
77 -
 78
78 -
 79
79 -
 80
80 -
 81
81 -
 82
82 -
 83
83 -
 84
84 -
 85
85 -
 86
86 -
 87
87 -
88
-
89
-
90
-
91
-
92
-
93
-
94
-
95
-
96
-
97
-
98
-
99
-
100
-
101
-
102
-
103
-
104
-
105
-
106
-
107
-
108
-
109
-
110
-
111
-
112
-
113
-
114
-
115
-
116
-
117
-
118
-
119
-
120
-
121
-
122
-
123
-
124
-
125
-
126
-
127
-
128
-
129
-
130
-
131
-
132
-
133
-
134
-
135
-
136
-
137
-
138
-
139
-
140
-
141
-
142
-
143
-
144
-
145
-
146
-
147
-
148
-
149
-
150
-
151
-
152
-
153
-
154
-
155
-
156
-
157
-
158
-
159
-
160
-
161
-
162
-
163
-
164
-
165
-
166
-
167
-
168
-
169
-
170
-
171
-
172
-
173
-
174
-
175
-
176
-
177
-
178
-
179
-
180
-
181
-
182
-
183
-
184
-
185
-
186
-
187
-
188
-
189
-
190
-
191
-
192
-
193
-
194
-
195
-
196
-
197
-
198
-
199
-
200
-
201
-
202
-
203
-
204
-
205
-
206
-
207
-
208
-
209
-
210
-
211
-
212
-
213
-
214
-
215
-
216
-
217
-
218
-
219
-
220
-
221
-
222
-
223
-
224
-
225
-
226
-
227
-
228
-
229
-
230
-
231
-
232
-
233
-
234
-
235
-
236
-
237
-
238
-
239
-
240
-
241
-
242
-
243
-
244
-
245
-
246
-
247
-
248
-
249
-
250
-
251
-
252
-
253
-
254
-
255
-
256
-
257
-
258
-
259
-
260
-
261
-
262
-
263
-
264
-
265
-
266
-
267
-
268
-
269
-
270
-
271
-
272
-
273
-
274
-
275
-
276
-
277
-
278
-
279
-
280
-
281
-
282
-
283
-
284
-
285
-
286
-
287
-
288
-
289
-
290
-
291
-
292
-
293
-
294
-
295
-
296
 |
 |

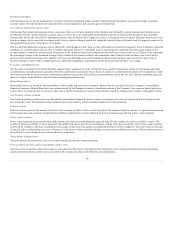
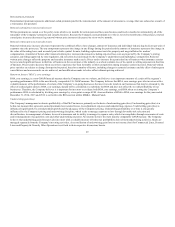
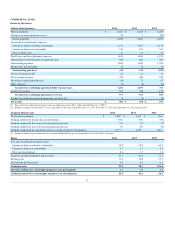
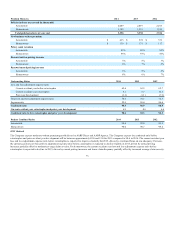
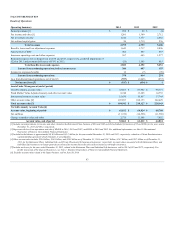
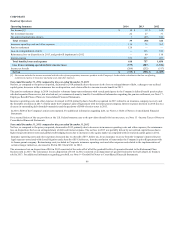
Losses and Loss Adjustment Expenses
Losses and loss adjustment expenses reflect a decline in current accident year catastrophes partially offset by lower favorable prior accident years
development.
• Current accident year losses and loss adjustment expenses before catastrophes increased in 2013 compared to 2012 in line with the growth in earned
premium and as reflected by the current accident year loss and loss adjustment expense ratio before catastrophes of 65.9 in 2013 as compared with
65.7 in 2012.
• Current accident year catastrophe losses of $207, before tax, in 2013 compared to $381, before tax in 2012. Losses in 2013 were primarily due to
multiple thunderstorm, hail and tornado events across various U.S. geographic regions. Losses in 2012 were primarily driven by losses from Storm
Sandy of $143 along with other thunderstorm and hail events across various U.S. geographic regions. For additional information, see MD&A -
Critical Accounting Estimates, Property and Casualty Insurance Product Reserves, Net of Reinsurance.
• Prior accident years reserve releases of $39, before tax, in 2013 compared to $141, before tax, in 2012. Reserve releases in 2013 were primarily
related to Storm Sandy. Reserve releases in 2012 were due to favorable emergence of losses in auto liability, homeowners and catastrophes. For
additional information, see MD&A - Critical Accounting Estimates, Property and Casualty Insurance Product Reserves, Net of Reinsurance.
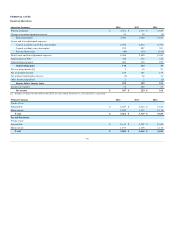
Underwriting Ratios
The combined ratio, before current accident year catastrophes and prior year development, stayed consistent at 92.3 for 2012 and 2013.
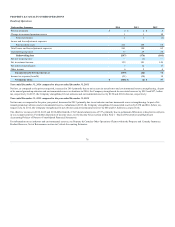
Investment Results
Investment income increased in 2014, as compared to the prior year period. For discussion of consolidated investment results, see MD&A - Investment
Results, Net Investment Income (Loss) and Net Realized Capital Gains (Losses).
Income Taxes
The effective tax rates in 2013 and 2012 differ from the U.S. Federal statutory rate of 35% primarily due to permanent differences related to investments in tax
exempt securities. For further discussion of income taxes, see Note 13 - Income Taxes of Notes to Consolidated Financial Statements.
77