The Hartford 2014 Annual Report Download - page 216
Download and view the complete annual report
Please find page 216 of the 2014 The Hartford annual report below. You can navigate through the pages in the report by either clicking on the pages listed below, or by using the keyword search tool below to find specific information within the annual report.-
 1
1 -
2
-
3
-
4
-
5
-
6
-
7
-
8
-
9
-
10
-
11
-
12
-
13
-
14
-
15
-
16
-
17
-
18
-
19
-
20
-
21
-
22
-
23
-
24
-
25
-
26
-
27
-
28
-
29
-
30
-
31
-
32
-
33
-
34
-
35
-
36
-
37
-
38
-
39
-
40
-
41
-
42
-
43
-
44
-
45
-
46
-
47
-
48
-
49
-
50
-
51
-
52
-
53
-
54
-
55
-
56
-
57
-
58
-
59
-
60
-
61
-
62
-
63
-
64
-
65
-
66
-
67
-
68
-
69
-
70
-
71
-
72
-
73
-
74
-
75
-
76
-
77
-
78
-
79
-
80
-
81
-
82
-
83
-
84
-
85
-
86
-
87
-
88
-
89
-
90
-
91
-
92
-
93
-
94
-
95
-
96
-
97
-
98
-
99
-
100
-
101
-
102
-
103
-
104
-
105
-
106
-
107
-
108
-
109
-
110
-
111
-
112
-
113
-
114
-
115
-
116
-
117
-
118
-
119
-
120
-
121
-
122
-
123
-
124
-
125
-
126
-
127
-
128
-
129
-
130
-
131
-
132
-
133
-
134
-
135
-
136
-
137
-
138
-
139
-
140
-
141
-
142
-
143
-
144
-
145
-
146
-
147
-
148
-
149
-
150
-
151
-
152
-
153
-
154
-
155
-
156
-
157
-
158
-
159
-
160
-
161
-
162
-
163
-
164
-
165
-
166
-
167
-
168
-
169
-
170
-
171
-
172
-
173
-
174
-
175
-
176
-
177
-
178
-
179
-
180
-
181
-
182
-
183
-
184
-
185
-
186
-
187
-
188
-
189
-
190
-
191
-
192
-
193
-
194
-
195
-
196
-
197
-
198
-
199
-
200
-
201
-
202
-
203
-
204
-
205
-
 206
206 -
 207
207 -
 208
208 -
 209
209 -
 210
210 -
 211
211 -
 212
212 -
 213
213 -
 214
214 -
 215
215 -
 216
216 -
 217
217 -
 218
218 -
 219
219 -
 220
220 -
 221
221 -
 222
222 -
 223
223 -
 224
224 -
 225
225 -
 226
226 -
227
-
228
-
229
-
230
-
231
-
232
-
233
-
234
-
235
-
236
-
237
-
238
-
239
-
240
-
241
-
242
-
243
-
244
-
245
-
246
-
247
-
248
-
249
-
250
-
251
-
252
-
253
-
254
-
255
-
256
-
257
-
258
-
259
-
260
-
261
-
262
-
263
-
264
-
265
-
266
-
267
-
268
-
269
-
270
-
271
-
272
-
273
-
274
-
275
-
276
-
277
-
278
-
279
-
280
-
281
-
282
-
283
-
284
-
285
-
286
-
287
-
288
-
289
-
290
-
291
-
292
-
293
-
294
-
295
-
296
 |
 |

Table of Contents
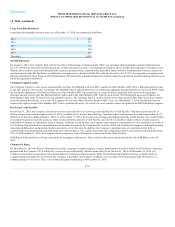
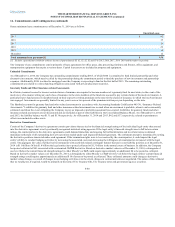
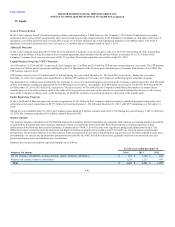
Future minimum lease commitments as of December 31, 2014 are as follows:
2015 $ 42
2016 35
2017 29
2018 22
2019 14
Thereafter 12
[1] Excludes expected future minimum sublease income of approximately $3, $2, $2, $2, $2 and $3 in 2015, 2016, 2017, 2018, 2019 and thereafter respectively.
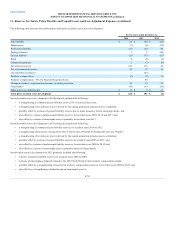
The Company’s lease commitments consist primarily of lease agreements for office space, data processing, furniture and fixtures, office equipment, and
transportation equipment that expire at various dates. Capital lease assets are included in property and equipment.
As of December 31, 2014, the Company has outstanding commitments totaling $865, of which $604 is committed to fund limited partnership and other
alternative investments, which may be called by the partnership during the commitment period to fund the purchase of new investments and partnership
expenses. Additionally, $246 is related to mortgage loans the Company is expecting to fund in the first half of 2015. The remaining outstanding
commitments are related to various funding obligations associated with private placement securities.
In all states, insurers licensed to transact certain classes of insurance are required to become members of a guaranty fund. In most states, in the event of the
insolvency of an insurer writing any such class of insurance in the state, members of the funds are assessed to pay certain claims of the insolvent insurers. A
particular state’s fund assesses its members based on their respective written premiums in the state for the classes of insurance in which the insolvent insurer
was engaged. Assessments are generally limited for any year to one or two percent of the premiums written per year depending on the state.
The Hartford accounts for guaranty fund and other related assessments in accordance with Accounting Standards Codification 405-30, “Insurance-Related
Assessments.” Liabilities for guaranty fund and other insurance-related assessments are accrued when an assessment is probable, when it can be reasonably
estimated, and when the event obligating the Company to pay an imposed or probable assessment has occurred. Liabilities for guaranty funds and other
insurance-related assessments are not discounted and are included as part of other liabilities in the Consolidated Balance Sheets. As of December 31, 2014
and 2013, the liability balance was $131 and $138 respectively. As of December 31, 2014 and 2013, $42 and $37, respectively, related to premium tax
offsets were included in other assets.
Certain of the Company’s derivative agreements contain provisions that are tied to the financial strength ratings of the individual legal entity that entered
into the derivative agreement as set by nationally recognized statistical rating agencies. If the legal entity’s financial strength were to fall below certain
ratings, the counterparties to the derivative agreements could demand immediate and ongoing full collateralization and in certain instances demand
immediate settlement of all outstanding derivative positions traded under each impacted bilateral agreement. The settlement amount is determined by netting
the derivative positions transacted under each agreement. If the termination rights were to be exercised by the counterparties, it could impact the legal
entity’s ability to conduct hedging activities by increasing the associated costs and decreasing the willingness of counterparties to transact with the legal
entity. The aggregate fair value of all derivative instruments with credit-risk-related contingent features that are in a net liability position as of December 31,
2014 is $1.0 billion. Of this $1.0 billion the legal entities have posted collateral of $1.3 billion in the normal course of business. In addition, the Company
has posted collateral of $41 associated with a customized GMWB derivative. Based on derivative market values as of December 31, 2014, a downgrade of
one level below the current financial strength ratings by either Moody’s or S&P could require approximately an additional $4 to be posted as collateral.
Based on derivative market values as of December 31, 2014, a downgrade by either Moody’s or S&P of two levels below the legal entities’ current financial
strength ratings could require approximately an additional $18 of assets to be posted as collateral. These collateral amounts could change as derivative
market values change, as a result of changes in our hedging activities or to the extent changes in contractual terms are negotiated. The nature of the collateral
that we would post, if required, would be primarily in the form of U.S. Treasury bills, U.S. Treasury notes and government agency securities.
F-80