The Hartford 2014 Annual Report Download - page 212
Download and view the complete annual report
Please find page 212 of the 2014 The Hartford annual report below. You can navigate through the pages in the report by either clicking on the pages listed below, or by using the keyword search tool below to find specific information within the annual report.-
 1
1 -
2
-
3
-
4
-
5
-
6
-
7
-
8
-
9
-
10
-
11
-
12
-
13
-
14
-
15
-
16
-
17
-
18
-
19
-
20
-
21
-
22
-
23
-
24
-
25
-
26
-
27
-
28
-
29
-
30
-
31
-
32
-
33
-
34
-
35
-
36
-
37
-
38
-
39
-
40
-
41
-
42
-
43
-
44
-
45
-
46
-
47
-
48
-
49
-
50
-
51
-
52
-
53
-
54
-
55
-
56
-
57
-
58
-
59
-
60
-
61
-
62
-
63
-
64
-
65
-
66
-
67
-
68
-
69
-
70
-
71
-
72
-
73
-
74
-
75
-
76
-
77
-
78
-
79
-
80
-
81
-
82
-
83
-
84
-
85
-
86
-
87
-
88
-
89
-
90
-
91
-
92
-
93
-
94
-
95
-
96
-
97
-
98
-
99
-
100
-
101
-
102
-
103
-
104
-
105
-
106
-
107
-
108
-
109
-
110
-
111
-
112
-
113
-
114
-
115
-
116
-
117
-
118
-
119
-
120
-
121
-
122
-
123
-
124
-
125
-
126
-
127
-
128
-
129
-
130
-
131
-
132
-
133
-
134
-
135
-
136
-
137
-
138
-
139
-
140
-
141
-
142
-
143
-
144
-
145
-
146
-
147
-
148
-
149
-
150
-
151
-
152
-
153
-
154
-
155
-
156
-
157
-
158
-
159
-
160
-
161
-
162
-
163
-
164
-
165
-
166
-
167
-
168
-
169
-
170
-
171
-
172
-
173
-
174
-
175
-
176
-
177
-
178
-
179
-
180
-
181
-
182
-
183
-
184
-
185
-
186
-
187
-
188
-
189
-
190
-
191
-
192
-
193
-
194
-
195
-
196
-
197
-
198
-
199
-
200
-
201
-
 202
202 -
 203
203 -
 204
204 -
 205
205 -
 206
206 -
 207
207 -
 208
208 -
 209
209 -
 210
210 -
 211
211 -
 212
212 -
 213
213 -
 214
214 -
 215
215 -
 216
216 -
 217
217 -
 218
218 -
 219
219 -
 220
220 -
 221
221 -
 222
222 -
223
-
224
-
225
-
226
-
227
-
228
-
229
-
230
-
231
-
232
-
233
-
234
-
235
-
236
-
237
-
238
-
239
-
240
-
241
-
242
-
243
-
244
-
245
-
246
-
247
-
248
-
249
-
250
-
251
-
252
-
253
-
254
-
255
-
256
-
257
-
258
-
259
-
260
-
261
-
262
-
263
-
264
-
265
-
266
-
267
-
268
-
269
-
270
-
271
-
272
-
273
-
274
-
275
-
276
-
277
-
278
-
279
-
280
-
281
-
282
-
283
-
284
-
285
-
286
-
287
-
288
-
289
-
290
-
291
-
292
-
293
-
294
-
295
-
296
 |
 |

Table of Contents
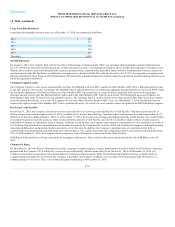
The Company has recorded a deferred tax asset valuation allowance that is adequate to reduce the total deferred tax asset to an amount that will more likely
than not be realized. In assessing the need for a valuation allowance, management considered future taxable temporary difference reversals, future taxable
income exclusive of reversing temporary differences and carryovers, taxable income in open carry back years and other tax planning strategies. From time to
time, tax planning strategies could include holding a portion of debt securities with market value losses until recovery, altering the level of tax exempt
securities held, making investments which have specific tax characteristics, and business considerations such as asset-liability matching. Management views
such tax planning strategies as prudent and feasible and would implement them, if necessary, to realize the deferred tax assets.
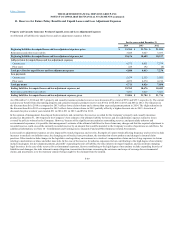
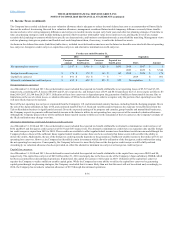
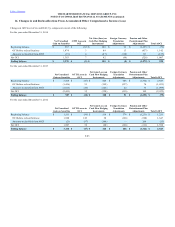
As shown in the deferred tax assets (liabilities) table above, included in net deferred income taxes are the future tax benefits associated with the net operating
loss carryover, foreign tax credit carryover, capital loss carryover, and alternative minimum tax credit carryover.
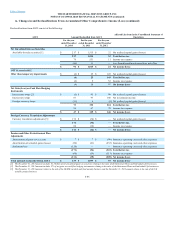
Net operating loss carryover $ 5,547 $ 1,936 $ 3,123 $ 1,093 2016 - 2017 $ 3
2023 - 2033 $ 5,544
Foreign tax credit carryover $ 178 $ 178 $ 163 $ 163 2018 - 2024 $ 178
Capital loss carryover $ 491 $ 172 $ — $ — 2019 $ 491
Alternative minimum tax credit carryover $ 652 $ 652 $ 823 $ 823 No expiration $ —
Net operating loss carryover
As of December 31, 2014 and 2013, the net deferred tax asset included the expected tax benefit attributable to net operating losses of $5,547 and $3,123,
respectively, consisting of U.S. losses of $5,508 and $3,123, respectively, and foreign losses of $39 and $0. If unutilized, the U.S. losses expire as follows: $3
from 2016-2017, $5,544 from 2023-2033. Utilization of these loss carryovers is dependent upon the generation of sufficient future taxable income. Due to
limitations on the use of certain losses, a valuation allowance of $9 has been established in order to recognize only the portion of net operating losses that
will more likely than not be realized.
Most of the net operating loss carryover originated from the Company's U.S. and international annuity business, including from the hedging program. Given
the sale of the Japan subsidiary in June 2014, and continued runoff of the U.S. fixed and variable annuity business, the exposure to taxable losses from the
Talcott Resolution business is significantly lessened. Given the expected earnings of its property and casualty, group benefits and mutual fund businesses,
the Company expects to generate sufficient taxable income in the future to utilize its net operating loss carryover net of the recorded valuation allowance.
Although the Company projects there will be sufficient future taxable income to fully recover the remainder of the loss carryover, the Company's estimate of
the likely realization may change over time.
Alternative minimum tax credit and foreign tax credit carryover
As of December 31, 2014 and 2013, the net deferred tax asset included the expected tax benefit attributable to alternative minimum tax credit carryover of
$652 and $823 and foreign tax credit carryover of $178 and $163 respectively. The alternative minimum tax credits have no expiration date and the foreign
tax credit carryover expire from 2018 to 2024. These credits are available to offset regular federal income taxes from future taxable income and although the
Company believes there will be sufficient future regular federal taxable income, there can be no certainty that future events will not affect the ability to
utilize the credits. Additionally, the use of the foreign tax credits generally depends on the generation of sufficient taxable income to first utilize all U.S. net
operating loss carryover. However, the Company has identified certain investments which allow for utilization of the foreign tax credits without first using
the net operating loss carryover. Consequently, the Company believes it is more likely than not the foreign tax credit carryover will be fully realized.
Accordingly, no valuation allowance has been provided on either the alternative minimum tax carryover or foreign tax credit carryover.
Capital loss carryover
As of December 31, 2014 and 2013, the net deferred tax asset included the expected tax benefit attributable to the capital loss carryover of $491 and $0,
respectively. The capital loss carryover of $491 at December 31, 2014 was largely due to the loss on sale of the Company’s Japan subsidiary, HLIKK, which
has been accounted for as discontinued operations. If unutilized, the capital loss carryover will expire in 2019. Utilization of the capital loss carryover
requires the Company to realize sufficient taxable capital gains. While the Company has some ability to utilize the capital loss carryover by generating
capital gains through tax planning strategies, the Company concluded that it is more likely than not that this asset will not be realized and, accordingly, in
2014, the Company has recorded a valuation allowance of $172 through discontinued operations.
F-76