The Hartford 2014 Annual Report Download - page 171
Download and view the complete annual report
Please find page 171 of the 2014 The Hartford annual report below. You can navigate through the pages in the report by either clicking on the pages listed below, or by using the keyword search tool below to find specific information within the annual report.-
 1
1 -
2
-
3
-
4
-
5
-
6
-
7
-
8
-
9
-
10
-
11
-
12
-
13
-
14
-
15
-
16
-
17
-
18
-
19
-
20
-
21
-
22
-
23
-
24
-
25
-
26
-
27
-
28
-
29
-
30
-
31
-
32
-
33
-
34
-
35
-
36
-
37
-
38
-
39
-
40
-
41
-
42
-
43
-
44
-
45
-
46
-
47
-
48
-
49
-
50
-
51
-
52
-
53
-
54
-
55
-
56
-
57
-
58
-
59
-
60
-
61
-
62
-
63
-
64
-
65
-
66
-
67
-
68
-
69
-
70
-
71
-
72
-
73
-
74
-
75
-
76
-
77
-
78
-
79
-
80
-
81
-
82
-
83
-
84
-
85
-
86
-
87
-
88
-
89
-
90
-
91
-
92
-
93
-
94
-
95
-
96
-
97
-
98
-
99
-
100
-
101
-
102
-
103
-
104
-
105
-
106
-
107
-
108
-
109
-
110
-
111
-
112
-
113
-
114
-
115
-
116
-
117
-
118
-
119
-
120
-
121
-
122
-
123
-
124
-
125
-
126
-
127
-
128
-
129
-
130
-
131
-
132
-
133
-
134
-
135
-
136
-
137
-
138
-
139
-
140
-
141
-
142
-
143
-
144
-
145
-
146
-
147
-
148
-
149
-
150
-
151
-
152
-
153
-
154
-
155
-
156
-
157
-
158
-
159
-
160
-
 161
161 -
 162
162 -
 163
163 -
 164
164 -
 165
165 -
 166
166 -
 167
167 -
 168
168 -
 169
169 -
 170
170 -
 171
171 -
 172
172 -
 173
173 -
 174
174 -
 175
175 -
 176
176 -
 177
177 -
 178
178 -
 179
179 -
 180
180 -
 181
181 -
182
-
183
-
184
-
185
-
186
-
187
-
188
-
189
-
190
-
191
-
192
-
193
-
194
-
195
-
196
-
197
-
198
-
199
-
200
-
201
-
202
-
203
-
204
-
205
-
206
-
207
-
208
-
209
-
210
-
211
-
212
-
213
-
214
-
215
-
216
-
217
-
218
-
219
-
220
-
221
-
222
-
223
-
224
-
225
-
226
-
227
-
228
-
229
-
230
-
231
-
232
-
233
-
234
-
235
-
236
-
237
-
238
-
239
-
240
-
241
-
242
-
243
-
244
-
245
-
246
-
247
-
248
-
249
-
250
-
251
-
252
-
253
-
254
-
255
-
256
-
257
-
258
-
259
-
260
-
261
-
262
-
263
-
264
-
265
-
266
-
267
-
268
-
269
-
270
-
271
-
272
-
273
-
274
-
275
-
276
-
277
-
278
-
279
-
280
-
281
-
282
-
283
-
284
-
285
-
286
-
287
-
288
-
289
-
290
-
291
-
292
-
293
-
294
-
295
-
296
 |
 |

Table of Contents
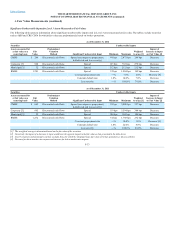
Product Derivatives
The Company formerly offered certain variable annuity products with GMWB riders. The GMWB provides the policyholder with a GRB which is generally
equal to premiums less withdrawals. If the policyholder’s account value is reduced to the specified level through a combination of market declines and
withdrawals but the GRB still has value, the Company is obligated to continue to make annuity payments to the policyholder until the GRB is exhausted.
Certain contract provisions can increase the GRB at contractholder election or after the passage of time. The GMWB represents an embedded derivative in
the variable annuity contract. When it is determined that (1) the embedded derivative possesses economic characteristics that are not clearly and closely
related to the economic characteristics of the host contract, and (2) a separate instrument with the same terms would qualify as a derivative instrument, the
embedded derivative is bifurcated from the host for measurement purposes. The embedded derivative is carried at fair value, with changes in fair value
reported in net realized capital gains and losses. The Company’s GMWB liability is reported in other policyholder funds and benefits payable in the
Consolidated Balance Sheets. The notional value of the embedded derivative is the GRB.
In valuing the embedded derivative, the Company attributes to the derivative a portion of the expected fees to be collected over the expected life of the
contract from the contract holder equal to the present value of future GMWB claims. The excess of fees collected from the contract holder in the current
period over the current period’s attributed fees are associated with the host variable annuity contract and reported in fee income.
GMWB Reinsurance Derivative
The Company has reinsurance arrangements in place to transfer a portion of its risk of loss due to GMWB. These arrangements are recognized as derivatives
and carried at fair value in reinsurance recoverables. Changes in the fair value of the reinsurance agreements are reported in net realized capital gains and
losses.
The fair value of the GMWB reinsurance derivative is calculated as an aggregation of the components described in the Living Benefits Required to be Fair
Valued discussion below and is modeled using significant unobservable policyholder behavior inputs, identical to those used in calculating the underlying
liability, such as lapses, fund selection, resets and withdrawal utilization and risk margins.
Living Benefits Required to be Fair Valued (in Other Policyholder Funds and Benefits Payable)
Fair values for GMWBs classified as embedded derivatives are calculated using the income approach based upon internally developed models because
active, observable markets do not exist for those items. The fair value of these GMWBs and the related reinsurance and customized freestanding derivatives
are calculated as an aggregation of the following components: Best Estimate Claim Payments; Credit Standing Adjustment; and Margins. The resulting
aggregation is reconciled or calibrated, if necessary, to market information that is, or may be, available to the Company, but may not be observable by other
market participants, including reinsurance discussions and transactions. The Company believes the aggregation of these components, as necessary and as
reconciled or calibrated to the market information available to the Company, results in an amount that the Company would be required to transfer or receive,
for an asset, to or from market participants in an active liquid market, if one existed, for those market participants to assume the risks associated with the
guaranteed minimum benefits and the related reinsurance and customized derivatives. The fair value is likely to materially diverge from the ultimate
settlement of the liability as the Company believes settlement will be based on our best estimate assumptions rather than those best estimate assumptions
plus risk margins. In the absence of any transfer of the guaranteed benefit liability to a third party, the release of risk margins is likely to be reflected as
realized gains in future periods’ net income. Each component described below is unobservable in the marketplace and require subjectivity by the Company
in determining their value. Oversight of the Company's valuation policies and processes for product and GMWB reinsurance derivatives is performed by a
multidisciplinary group comprised of finance, actuarial and risk management professionals. This multidisciplinary group reviews and approves changes and
enhancements to the Company's valuation model as well as associated controls.
Best Estimate
Claim Payments
The Best Estimate Claim Payments is calculated based on actuarial and capital market assumptions related to projected cash flows, including the present
value of benefits and related contract charges, over the lives of the contracts, incorporating expectations concerning policyholder behavior such as lapses,
fund selection, resets and withdrawal utilization. For the customized derivatives, policyholder behavior is prescribed in the derivative contract. Because of
the dynamic and complex nature of these cash flows, best estimate assumptions and a Monte Carlo stochastic process is used in valuation. The Monte Carlo
stochastic process involves the generation of thousands of scenarios that assume risk neutral returns consistent with swap rates and a blend of observable
implied index volatility levels. Estimating these cash flows involves numerous estimates and subjective judgments regarding a number of variables. These
variables include expected market rates of return, market volatility, correlations of market index returns to funds, fund performance, discount rates, and
assumptions about policyholder behavior which emerge over time.
F-35