The Hartford 2014 Annual Report Download - page 115
Download and view the complete annual report
Please find page 115 of the 2014 The Hartford annual report below. You can navigate through the pages in the report by either clicking on the pages listed below, or by using the keyword search tool below to find specific information within the annual report.-
 1
1 -
2
-
3
-
4
-
5
-
6
-
7
-
8
-
9
-
10
-
11
-
12
-
13
-
14
-
15
-
16
-
17
-
18
-
19
-
20
-
21
-
22
-
23
-
24
-
25
-
26
-
27
-
28
-
29
-
30
-
31
-
32
-
33
-
34
-
35
-
36
-
37
-
38
-
39
-
40
-
41
-
42
-
43
-
44
-
45
-
46
-
47
-
48
-
49
-
50
-
51
-
52
-
53
-
54
-
55
-
56
-
57
-
58
-
59
-
60
-
61
-
62
-
63
-
64
-
65
-
66
-
67
-
68
-
69
-
70
-
71
-
72
-
73
-
74
-
75
-
76
-
77
-
78
-
79
-
80
-
81
-
82
-
83
-
84
-
85
-
86
-
87
-
88
-
89
-
90
-
91
-
92
-
93
-
94
-
95
-
96
-
97
-
98
-
99
-
100
-
101
-
102
-
103
-
104
-
 105
105 -
 106
106 -
 107
107 -
 108
108 -
 109
109 -
 110
110 -
 111
111 -
 112
112 -
 113
113 -
 114
114 -
 115
115 -
 116
116 -
 117
117 -
 118
118 -
 119
119 -
 120
120 -
 121
121 -
 122
122 -
 123
123 -
 124
124 -
 125
125 -
126
-
127
-
128
-
129
-
130
-
131
-
132
-
133
-
134
-
135
-
136
-
137
-
138
-
139
-
140
-
141
-
142
-
143
-
144
-
145
-
146
-
147
-
148
-
149
-
150
-
151
-
152
-
153
-
154
-
155
-
156
-
157
-
158
-
159
-
160
-
161
-
162
-
163
-
164
-
165
-
166
-
167
-
168
-
169
-
170
-
171
-
172
-
173
-
174
-
175
-
176
-
177
-
178
-
179
-
180
-
181
-
182
-
183
-
184
-
185
-
186
-
187
-
188
-
189
-
190
-
191
-
192
-
193
-
194
-
195
-
196
-
197
-
198
-
199
-
200
-
201
-
202
-
203
-
204
-
205
-
206
-
207
-
208
-
209
-
210
-
211
-
212
-
213
-
214
-
215
-
216
-
217
-
218
-
219
-
220
-
221
-
222
-
223
-
224
-
225
-
226
-
227
-
228
-
229
-
230
-
231
-
232
-
233
-
234
-
235
-
236
-
237
-
238
-
239
-
240
-
241
-
242
-
243
-
244
-
245
-
246
-
247
-
248
-
249
-
250
-
251
-
252
-
253
-
254
-
255
-
256
-
257
-
258
-
259
-
260
-
261
-
262
-
263
-
264
-
265
-
266
-
267
-
268
-
269
-
270
-
271
-
272
-
273
-
274
-
275
-
276
-
277
-
278
-
279
-
280
-
281
-
282
-
283
-
284
-
285
-
286
-
287
-
288
-
289
-
290
-
291
-
292
-
293
-
294
-
295
-
296
 |
 |

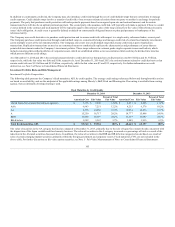
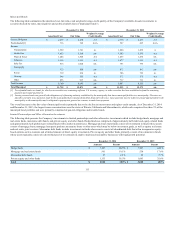
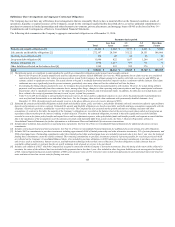
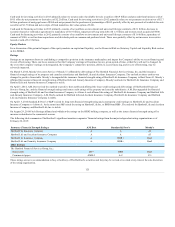
Other-Than-Temporary Impairments
The following table presents the Company’s impairments recognized in earnings by security type excluding intent-to-sell impairment relating to the sales of
Retirement Plans and Individual Life businesses.
ABS $ — $ 9 $ 29
CRE CDOs — 2 10
CMBS
Bonds 2 17 24
IOs 1 4 3
Corporate 35 20 28
Equity 11 15 65
Municipal 3 — —
Agency 3 — —
RMBS Non-agency
RMBS Alt-A — — 1
Sub-prime 1 6 12
Other 3 — —
Total
[1] Excludes $177 of intent-to-sell impairments related to the sales of the Retirement Plans and Individual Life businesses.
Year ended December 31, 2014
For the year ended December 31, 2014, impairments recognized in earnings were comprised of credit impairments of $37, securities that the Company intends
to sell of $17, impairments on equity securities of $2, and other impairments of $3.
Impairments for the year ended December 31, 2014 were primarily credit impairments concentrated in corporate securities. The corporate securities were
impaired due to certain issuers that have experienced financial difficulty and either defaulted or are expected to default on contractually obligated principal
and interest payments. Also included in credit impairments for the year ended December 31, 2014, were private placements that were impaired due to declines
in expected cash flows related to the underlying referenced securities. The Company’s determination of expected future cash flows used to calculate the
credit loss amount is a quantitative and qualitative process. The Company incorporates its best estimate of future cash flows using internal assumptions and
judgments that are informed by economic and industry specific trends, as well as our expectation with respect to security specific developments. Credit
impairments for the year ended December 31, 2014 were primarily identified through security specific reviews and resulted from changes in the financial
condition and near term prospects of certain issuers. Other impairments for the year ended December 31, 2014 primarily related to certain equity, AFS
securities with debt-like characteristics that the Company intends to sell.
In addition to the credit impairments recognized in earnings, the Company recognized non-credit impairments in other comprehensive income of $5 for the
year ended December 31, 2014, predominantly concentrated in corporate securities and CMBS. These non-credit impairments represent the difference
between fair value and the Company’s best estimate of expected future cash flows discounted at the security’s effective yield prior to impairment, rather than
at current market implied credit spreads. These non-credit impairments primarily represent increases in market liquidity premiums and credit spread widening
that occurred after the securities were purchased, as well as a discount for variable-rate coupons which are paying less than at purchase date. In general, larger
liquidity premiums and wider credit spreads are the result of deterioration of the underlying collateral performance of the securities, as well as the risk
premium required to reflect future uncertainty in the real estate market.
Future impairments may develop as the result of changes in intent to sell specific securities or if actual results underperform current modeling assumptions,
which may be the result of, but are not limited to, macroeconomic factors and security-specific performance below current expectations. Ultimate loss
formation will be a function of macroeconomic factors and idiosyncratic security-specific performance.
115