The Hartford 2014 Annual Report Download - page 106
Download and view the complete annual report
Please find page 106 of the 2014 The Hartford annual report below. You can navigate through the pages in the report by either clicking on the pages listed below, or by using the keyword search tool below to find specific information within the annual report.-
 1
1 -
2
-
3
-
4
-
5
-
6
-
7
-
8
-
9
-
10
-
11
-
12
-
13
-
14
-
15
-
16
-
17
-
18
-
19
-
20
-
21
-
22
-
23
-
24
-
25
-
26
-
27
-
28
-
29
-
30
-
31
-
32
-
33
-
34
-
35
-
36
-
37
-
38
-
39
-
40
-
41
-
42
-
43
-
44
-
45
-
46
-
47
-
48
-
49
-
50
-
51
-
52
-
53
-
54
-
55
-
56
-
57
-
58
-
59
-
60
-
61
-
62
-
63
-
64
-
65
-
66
-
67
-
68
-
69
-
70
-
71
-
72
-
73
-
74
-
75
-
76
-
77
-
78
-
79
-
80
-
81
-
82
-
83
-
84
-
85
-
86
-
87
-
88
-
89
-
90
-
91
-
92
-
93
-
94
-
95
-
 96
96 -
 97
97 -
 98
98 -
 99
99 -
 100
100 -
 101
101 -
 102
102 -
 103
103 -
 104
104 -
 105
105 -
 106
106 -
 107
107 -
 108
108 -
 109
109 -
 110
110 -
 111
111 -
 112
112 -
 113
113 -
 114
114 -
 115
115 -
 116
116 -
117
-
118
-
119
-
120
-
121
-
122
-
123
-
124
-
125
-
126
-
127
-
128
-
129
-
130
-
131
-
132
-
133
-
134
-
135
-
136
-
137
-
138
-
139
-
140
-
141
-
142
-
143
-
144
-
145
-
146
-
147
-
148
-
149
-
150
-
151
-
152
-
153
-
154
-
155
-
156
-
157
-
158
-
159
-
160
-
161
-
162
-
163
-
164
-
165
-
166
-
167
-
168
-
169
-
170
-
171
-
172
-
173
-
174
-
175
-
176
-
177
-
178
-
179
-
180
-
181
-
182
-
183
-
184
-
185
-
186
-
187
-
188
-
189
-
190
-
191
-
192
-
193
-
194
-
195
-
196
-
197
-
198
-
199
-
200
-
201
-
202
-
203
-
204
-
205
-
206
-
207
-
208
-
209
-
210
-
211
-
212
-
213
-
214
-
215
-
216
-
217
-
218
-
219
-
220
-
221
-
222
-
223
-
224
-
225
-
226
-
227
-
228
-
229
-
230
-
231
-
232
-
233
-
234
-
235
-
236
-
237
-
238
-
239
-
240
-
241
-
242
-
243
-
244
-
245
-
246
-
247
-
248
-
249
-
250
-
251
-
252
-
253
-
254
-
255
-
256
-
257
-
258
-
259
-
260
-
261
-
262
-
263
-
264
-
265
-
266
-
267
-
268
-
269
-
270
-
271
-
272
-
273
-
274
-
275
-
276
-
277
-
278
-
279
-
280
-
281
-
282
-
283
-
284
-
285
-
286
-
287
-
288
-
289
-
290
-
291
-
292
-
293
-
294
-
295
-
296
 |
 |
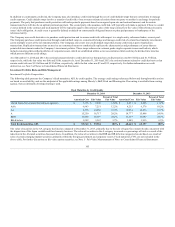
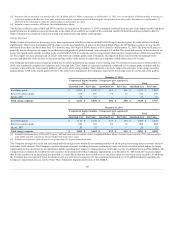
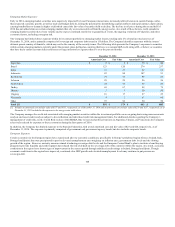
The following table presents the Company’s AFS securities by type, as well as fixed maturities and equity, FVO.
ABS
Consumer loans $ 2,052 $ 14 $ (28) $ 2,038 3.4% $ 1,982 $ 11 $ (48) $ 1,945 3.1%
Small business 166 14 (8) 172 0.3% 194 3 (16) 181 0.3%
Other 252 11 (1) 262 0.4% 228 11 — 239 0.4%
Collateralized debt obligations
("CDOs")
Collateralized loan obligations
(“CLOs”) 2,279 4 (17) 2,266 3.8% 1,781 3 (34) 1,750 2.8%
Commercial real estate ("CREs") 114 88 (9) 193 0.3% 176 88 (16) 248 0.4%
Other [1] 383 6 (10) 382 0.6% 383 17 (9) 389 0.6%
Commercial mortgage-backed
securities ("CMBS")
Agency backed [2] 1,136 45 (1) 1,180 2.0% 1,068 20 (12) 1,076 1.7%
Bonds 2,594 126 (4) 2,716 4.6% 2,836 168 (31) 2,973 4.8%
Interest only (“IOs”) 505 25 (11) 519 0.9% 384 28 (15) 397 0.6%
Corporate
Basic industry 1,673 105 (22) 1,756 3.0% 2,085 106 (38) 2,153 3.5%
Capital goods 1,880 192 (4) 2,068 3.5% 2,077 161 (14) 2,224 3.6%
Consumer cyclical 1,647 128 (8) 1,767 3.0% 1,801 119 (17) 1,903 3.1%
Consumer non-cyclical 3,473 335 (5) 3,803 6.4% 3,600 288 (21) 3,867 6.2%
Energy [3] 3,092 252 (49) 3,295 5.5% 3,407 242 (21) 3,628 5.8%
Financial services 4,942 405 (94) 5,253 8.8% 5,044 287 (145) 5,186 8.3%
Tech./comm. 3,150 370 (12) 3,508 5.9% 3,223 223 (28) 3,418 5.5%
Transportation 891 82 (4) 969 1.6% 972 65 (13) 1,024 1.6%
Utilities [3] 4,278 496 (13) 4,761 8.0% 4,582 318 (47) 4,853 7.8%
Other 162 17 — 179 0.3% 222 14 (2) 234 0.4%
Foreign govt./govt. agencies 1,592 73 (29) 1,636 2.8% 4,228 52 (176) 4,104 6.6%
Municipal
Taxable 1,135 135 (2) 1,268 2.1% 1,299 32 (67) 1,264 2.0%
Tax-exempt 10,600 1,006 (3) 11,603 19.5% 10,633 393 (117) 10,909 17.5%
RMBS
Agency 2,448 98 (2) 2,544 4.3% 3,366 59 (38) 3,387 5.4%
Non-agency 81 3 — 84 0.1% 86 — — 86 0.1%
Alt-A 55 1 — 56 0.1% — — — — —%
Sub-prime 1,231 20 (17) 1,234 2.1% 1,187 31 (44) 1,174 1.9%
U.S. Treasuries 3,551 326 (5) 3,872 6.5% 3,797 7 (59) 3,745 6.0%
Equity securities
Financial services 149 13 — 162 23.2% 233 11 (29) 215 24.8%
Other 527 37 (27) 537 76.8% 617 56 (20) 653 75.2%
[1] Gross unrealized gains (losses) exclude the fair value of bifurcated embedded derivative features of certain securities. Changes in value are recorded in net realized capital
gains (losses).
[2] Includes securities with pools of loans issued by the Small Business Administration which are backed by the full faith and credit of the U.S. government.
106