The Hartford 2014 Annual Report Download - page 184
Download and view the complete annual report
Please find page 184 of the 2014 The Hartford annual report below. You can navigate through the pages in the report by either clicking on the pages listed below, or by using the keyword search tool below to find specific information within the annual report.-
 1
1 -
2
-
3
-
4
-
5
-
6
-
7
-
8
-
9
-
10
-
11
-
12
-
13
-
14
-
15
-
16
-
17
-
18
-
19
-
20
-
21
-
22
-
23
-
24
-
25
-
26
-
27
-
28
-
29
-
30
-
31
-
32
-
33
-
34
-
35
-
36
-
37
-
38
-
39
-
40
-
41
-
42
-
43
-
44
-
45
-
46
-
47
-
48
-
49
-
50
-
51
-
52
-
53
-
54
-
55
-
56
-
57
-
58
-
59
-
60
-
61
-
62
-
63
-
64
-
65
-
66
-
67
-
68
-
69
-
70
-
71
-
72
-
73
-
74
-
75
-
76
-
77
-
78
-
79
-
80
-
81
-
82
-
83
-
84
-
85
-
86
-
87
-
88
-
89
-
90
-
91
-
92
-
93
-
94
-
95
-
96
-
97
-
98
-
99
-
100
-
101
-
102
-
103
-
104
-
105
-
106
-
107
-
108
-
109
-
110
-
111
-
112
-
113
-
114
-
115
-
116
-
117
-
118
-
119
-
120
-
121
-
122
-
123
-
124
-
125
-
126
-
127
-
128
-
129
-
130
-
131
-
132
-
133
-
134
-
135
-
136
-
137
-
138
-
139
-
140
-
141
-
142
-
143
-
144
-
145
-
146
-
147
-
148
-
149
-
150
-
151
-
152
-
153
-
154
-
155
-
156
-
157
-
158
-
159
-
160
-
161
-
162
-
163
-
164
-
165
-
166
-
167
-
168
-
169
-
170
-
171
-
172
-
173
-
 174
174 -
 175
175 -
 176
176 -
 177
177 -
 178
178 -
 179
179 -
 180
180 -
 181
181 -
 182
182 -
 183
183 -
 184
184 -
 185
185 -
 186
186 -
 187
187 -
 188
188 -
 189
189 -
 190
190 -
 191
191 -
 192
192 -
 193
193 -
 194
194 -
195
-
196
-
197
-
198
-
199
-
200
-
201
-
202
-
203
-
204
-
205
-
206
-
207
-
208
-
209
-
210
-
211
-
212
-
213
-
214
-
215
-
216
-
217
-
218
-
219
-
220
-
221
-
222
-
223
-
224
-
225
-
226
-
227
-
228
-
229
-
230
-
231
-
232
-
233
-
234
-
235
-
236
-
237
-
238
-
239
-
240
-
241
-
242
-
243
-
244
-
245
-
246
-
247
-
248
-
249
-
250
-
251
-
252
-
253
-
254
-
255
-
256
-
257
-
258
-
259
-
260
-
261
-
262
-
263
-
264
-
265
-
266
-
267
-
268
-
269
-
270
-
271
-
272
-
273
-
274
-
275
-
276
-
277
-
278
-
279
-
280
-
281
-
282
-
283
-
284
-
285
-
286
-
287
-
288
-
289
-
290
-
291
-
292
-
293
-
294
-
295
-
296
 |
 |

Table of Contents
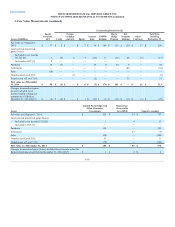
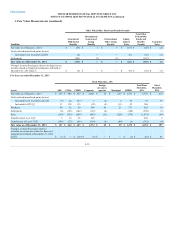
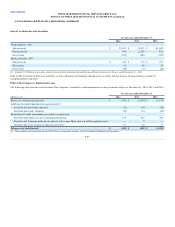
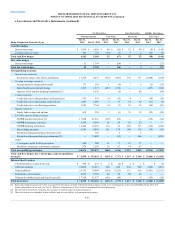
As of December 31, 2014, AFS securities in an unrealized loss position, consisted of 3,065 securities, primarily in the corporate sector, which are depressed
primarily due to an increase in interest rates and/or wider credit spreads since the securities were purchased. As of December 31, 2014, 92% of these securities
were depressed less than 20% of cost or amortized cost. The decrease in unrealized losses during 2014 was primarily attributable to a decrease in interest
rates.
Most of the securities depressed for twelve months or more relate to certain floating rate corporate securities with greater than 10 years to maturity
concentrated in the financial services sector and structured securities with exposure to commercial and residential real estate. Corporate securities are
primarily depressed because the securities have floating-rate coupons and have long-dated maturities or are perpetual and current credit spreads are wider
than when these securities were purchased. For certain commercial and residential real estate securities, current market spreads continue to be wider than
spreads at the securities' respective purchase dates, even though credit spreads have continued to tighten over the past five years. The Company neither has
an intention to sell nor does it expect to be required to sell the securities outlined above.
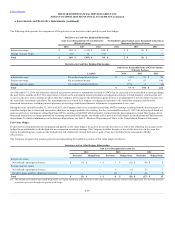
[1] Amortized cost represents carrying value prior to valuation allowances, if any.
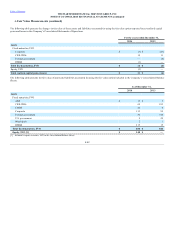
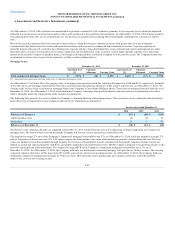
As of December 31, 2014 and 2013, the carrying value of mortgage loans associated with the valuation allowance was $140 and $191, respectively. Included
in the table above are mortgage loans held-for-sale with a carrying value and valuation allowance of $61 and $3, respectively, as of December 31, 2013. The
carrying value of these loans is included in mortgage loans in the Company’s Consolidated Balance Sheets. There were no mortgage loans held-for-sale as of
December 31, 2014. As of December 31, 2014, loans within the Company’s mortgage loan portfolio that have had extensions or restructurings other than
what is allowable under the original terms of the contract are immaterial.
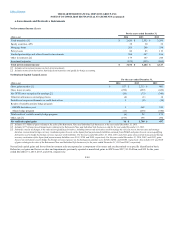
The following table presents the activity within the Company’s valuation allowance for mortgage loans. These loans have been evaluated both individually
and collectively for impairment. Loans evaluated collectively for impairment are immaterial.
(Additions)/Reversals (4) (2) 14
Deductions 53 3 20
The decline in the valuation allowance as compared to December 31, 2013 resulted from the sale of the underlying collateral supporting one commercial
mortgage loan. The loan was fully reserved for and the Company did not recover any proceeds as a result of the sale.
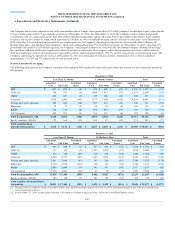
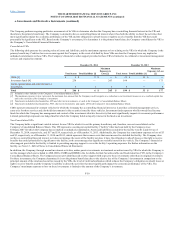
The weighted-average LTV ratio of the Company’s commercial mortgage loan portfolio was 57% as of December 31, 2014, while the weighted-average LTV
ratio at origination of these loans was 62%. LTV ratios compare the loan amount to the value of the underlying property collateralizing the loan. The loan
values are updated no less than annually through property level reviews of the portfolio. Factors considered in the property valuation include, but are not
limited to, actual and expected property cash flows, geographic market data and capitalization rates. DSCRs compare a property’s net operating income to the
borrower’s principal and interest payments. The weighted average DSCR of the Company’s commercial mortgage loan portfolio was 2.51x as of
December 31, 2014. As of December 31, 2014, the Company held only one delinquent commercial mortgage loan past due by 90 days or more. The carrying
value and valuation allowance of this loan totaled $7 and $0, respectively, and was not accruing income. As of December 31, 2013, the Company held one
delinquent commercial mortgage loan past due by 90 days or more. This loan had a total carrying value and valuation allowance totaled $0 and $50,
respectively, and was not accruing income.
F-48