The Hartford 2014 Annual Report Download - page 162
Download and view the complete annual report
Please find page 162 of the 2014 The Hartford annual report below. You can navigate through the pages in the report by either clicking on the pages listed below, or by using the keyword search tool below to find specific information within the annual report.-
 1
1 -
2
-
3
-
4
-
5
-
6
-
7
-
8
-
9
-
10
-
11
-
12
-
13
-
14
-
15
-
16
-
17
-
18
-
19
-
20
-
21
-
22
-
23
-
24
-
25
-
26
-
27
-
28
-
29
-
30
-
31
-
32
-
33
-
34
-
35
-
36
-
37
-
38
-
39
-
40
-
41
-
42
-
43
-
44
-
45
-
46
-
47
-
48
-
49
-
50
-
51
-
52
-
53
-
54
-
55
-
56
-
57
-
58
-
59
-
60
-
61
-
62
-
63
-
64
-
65
-
66
-
67
-
68
-
69
-
70
-
71
-
72
-
73
-
74
-
75
-
76
-
77
-
78
-
79
-
80
-
81
-
82
-
83
-
84
-
85
-
86
-
87
-
88
-
89
-
90
-
91
-
92
-
93
-
94
-
95
-
96
-
97
-
98
-
99
-
100
-
101
-
102
-
103
-
104
-
105
-
106
-
107
-
108
-
109
-
110
-
111
-
112
-
113
-
114
-
115
-
116
-
117
-
118
-
119
-
120
-
121
-
122
-
123
-
124
-
125
-
126
-
127
-
128
-
129
-
130
-
131
-
132
-
133
-
134
-
135
-
136
-
137
-
138
-
139
-
140
-
141
-
142
-
143
-
144
-
145
-
146
-
147
-
148
-
149
-
150
-
151
-
 152
152 -
 153
153 -
 154
154 -
 155
155 -
 156
156 -
 157
157 -
 158
158 -
 159
159 -
 160
160 -
 161
161 -
 162
162 -
 163
163 -
 164
164 -
 165
165 -
 166
166 -
 167
167 -
 168
168 -
 169
169 -
 170
170 -
 171
171 -
 172
172 -
173
-
174
-
175
-
176
-
177
-
178
-
179
-
180
-
181
-
182
-
183
-
184
-
185
-
186
-
187
-
188
-
189
-
190
-
191
-
192
-
193
-
194
-
195
-
196
-
197
-
198
-
199
-
200
-
201
-
202
-
203
-
204
-
205
-
206
-
207
-
208
-
209
-
210
-
211
-
212
-
213
-
214
-
215
-
216
-
217
-
218
-
219
-
220
-
221
-
222
-
223
-
224
-
225
-
226
-
227
-
228
-
229
-
230
-
231
-
232
-
233
-
234
-
235
-
236
-
237
-
238
-
239
-
240
-
241
-
242
-
243
-
244
-
245
-
246
-
247
-
248
-
249
-
250
-
251
-
252
-
253
-
254
-
255
-
256
-
257
-
258
-
259
-
260
-
261
-
262
-
263
-
264
-
265
-
266
-
267
-
268
-
269
-
270
-
271
-
272
-
273
-
274
-
275
-
276
-
277
-
278
-
279
-
280
-
281
-
282
-
283
-
284
-
285
-
286
-
287
-
288
-
289
-
290
-
291
-
292
-
293
-
294
-
295
-
296
 |
 |

Table of Contents
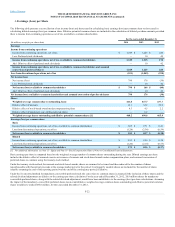
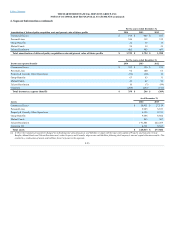
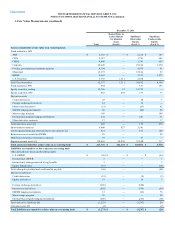
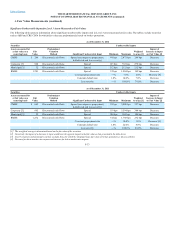
The following tables present assets and (liabilities) carried at fair value by hierarchy level. These disclosures provide information as to the extent to which the
Company uses fair value to measure financial instruments and information about the inputs used to value those financial instruments to allow users to assess
the relative reliability of the measurements. The following table presents assets and (liabilities) carried at fair value by hierarchy level.
Fixed maturities, AFS
Asset backed securities ("ABS") $ 2,472 $ — $ 2,350 $ 122
Collateralized debt obligations ("CDOs") 2,841 — 2,218 623
Commercial mortgage-backed securities ("CMBS") 4,415 — 4,131 284
Corporate 27,359 — 26,319 1,040
Foreign government/government agencies 1,636 — 1,577 59
States, municipalities and political subdivisions (“Municipal”) 12,871 — 12,805 66
Residential mortgage-backed securities ("RMBS") 3,918 — 2,637 1,281
U.S. Treasuries 3,872 106 3,766 —
Total fixed maturities 59,384 106 55,803 3,475
Fixed maturities, FVO 488 — 396 92
Equity securities, trading 11 11 — —
Equity securities, AFS 1,047 786 163 98
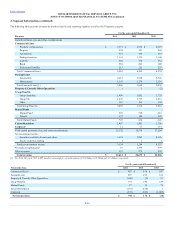
Derivative assets
Credit derivatives 8 — 10 (2)
Equity derivatives 3 — — 3
Interest rate derivatives 129 — 113 16
GMWB hedging instruments 119 — 5 114
Macro hedge program 93 — — 93
Other derivative contracts 12 — — 12
Total derivative assets [1] 364 — 128 236
Short-term investments 4,883 349 4,534 —
Limited partnerships and other alternative investments [2] 770 — 581 189
Reinsurance recoverable for GMWB 56 — — 56
Modified coinsurance reinsurance contracts 34 — 34 —
Separate account assets [3] 132,211 91,537 40,096 578
Other policyholder funds and benefits payable
GMWB $ (139) $ — $ — $ (139)
Equity linked notes (26) — — (26)
Total other policyholder funds and benefits payable (165) — — (165)
Derivative liabilities
Credit derivatives (16) — (9) (7)
Equity derivatives 28 — 25 3
Foreign exchange derivatives (445) — (445) —
Interest rate derivatives (597) — (574) (23)
GMWB hedging instruments 55 — (1) 56
Macro hedge program 48 — — 48
Total derivative liabilities [4] (927) — (1,004) 77
Consumer notes [5] (3) — — (3)
F-27