The Hartford 2014 Annual Report Download - page 81
Download and view the complete annual report
Please find page 81 of the 2014 The Hartford annual report below. You can navigate through the pages in the report by either clicking on the pages listed below, or by using the keyword search tool below to find specific information within the annual report.-
 1
1 -
2
-
3
-
4
-
5
-
6
-
7
-
8
-
9
-
10
-
11
-
12
-
13
-
14
-
15
-
16
-
17
-
18
-
19
-
20
-
21
-
22
-
23
-
24
-
25
-
26
-
27
-
28
-
29
-
30
-
31
-
32
-
33
-
34
-
35
-
36
-
37
-
38
-
39
-
40
-
41
-
42
-
43
-
44
-
45
-
46
-
47
-
48
-
49
-
50
-
51
-
52
-
53
-
54
-
55
-
56
-
57
-
58
-
59
-
60
-
61
-
62
-
63
-
64
-
65
-
66
-
67
-
68
-
69
-
70
-
 71
71 -
 72
72 -
 73
73 -
 74
74 -
 75
75 -
 76
76 -
 77
77 -
 78
78 -
 79
79 -
 80
80 -
 81
81 -
 82
82 -
 83
83 -
 84
84 -
 85
85 -
 86
86 -
 87
87 -
 88
88 -
 89
89 -
 90
90 -
 91
91 -
92
-
93
-
94
-
95
-
96
-
97
-
98
-
99
-
100
-
101
-
102
-
103
-
104
-
105
-
106
-
107
-
108
-
109
-
110
-
111
-
112
-
113
-
114
-
115
-
116
-
117
-
118
-
119
-
120
-
121
-
122
-
123
-
124
-
125
-
126
-
127
-
128
-
129
-
130
-
131
-
132
-
133
-
134
-
135
-
136
-
137
-
138
-
139
-
140
-
141
-
142
-
143
-
144
-
145
-
146
-
147
-
148
-
149
-
150
-
151
-
152
-
153
-
154
-
155
-
156
-
157
-
158
-
159
-
160
-
161
-
162
-
163
-
164
-
165
-
166
-
167
-
168
-
169
-
170
-
171
-
172
-
173
-
174
-
175
-
176
-
177
-
178
-
179
-
180
-
181
-
182
-
183
-
184
-
185
-
186
-
187
-
188
-
189
-
190
-
191
-
192
-
193
-
194
-
195
-
196
-
197
-
198
-
199
-
200
-
201
-
202
-
203
-
204
-
205
-
206
-
207
-
208
-
209
-
210
-
211
-
212
-
213
-
214
-
215
-
216
-
217
-
218
-
219
-
220
-
221
-
222
-
223
-
224
-
225
-
226
-
227
-
228
-
229
-
230
-
231
-
232
-
233
-
234
-
235
-
236
-
237
-
238
-
239
-
240
-
241
-
242
-
243
-
244
-
245
-
246
-
247
-
248
-
249
-
250
-
251
-
252
-
253
-
254
-
255
-
256
-
257
-
258
-
259
-
260
-
261
-
262
-
263
-
264
-
265
-
266
-
267
-
268
-
269
-
270
-
271
-
272
-
273
-
274
-
275
-
276
-
277
-
278
-
279
-
280
-
281
-
282
-
283
-
284
-
285
-
286
-
287
-
288
-
289
-
290
-
291
-
292
-
293
-
294
-
295
-
296
 |
 |

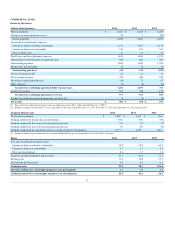
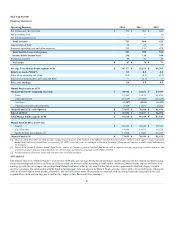
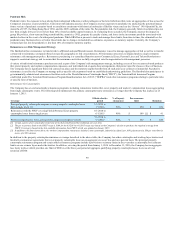
Results of Operations
Fee income and other revenue $ 723 $ 668 $ 626
Net investment loss — — (3)
Net realized capital losses — — —
Amortization of DAC 28 39 35
Insurance operating costs and other expenses 559 511 479
Income tax expense 49 42 38
Effect of restructuring, net of tax (0.5) (0.2) (0.3)
Effect of net realized gains, net of tax and DAC — (0.1) —
Sales 15,249 15,172 11,841
Redemptions [1] (16,636) (19,696) (16,258)
Net flows
Change in market value and other 3,504 13,831 8,103
Equity $ 45,221 $ 42,426 $ 35,843
Fixed Income 14,046 14,632 14,524
Multi-Strategy Investments [3] 13,768 13,860 11,244
[1] The year ended December 31, 2014 includes a planned asset transfer of $0.7 billion to the HIMCO Variable Insurance Trust (“HVIT”) which supports legacy retirement
mutual funds and runoff mutual funds (see footnote [3]). HVIT's invested assets are managed by Hartford Investment Management Company, a wholly-owned subsidiary of
the Company.
[2] Talcott AUM (formerly Annuity Mutual Fund Assets) consist of Company-sponsored mutual fund assets held in separate accounts supporting variable insurance and
investment products. The year ended December 31, 2014 includes a planned asset transfer of $2.0 billion to HVIT.
[3] Includes balanced, allocation, target date and alternative investment products.
2015 Outlook
The primary objective of Mutual Funds is to grow total AUM and core earnings. Strong fund performance, market appreciation, developing and maintaining
client relationships and positive net flows are all factors that can increase AUM. Assuming normal market conditions, Mutual Funds expects moderate 2015
earnings growth driven by improved earnings from Mutual Fund assets offset by the runoff of the Talcott assets supporting the Hartford's legacy variable
insurance products. The relationship with Wellington Management, sole sub-advisor for Mutual Funds, provides clients with a diversified lineup of domestic
and international equity, fixed income, alternative, and asset allocation funds. These products combined with our strong long-term fund performance and
expanded key client relationships are critical to drive improved net flows and future earnings.
81