The Hartford 2014 Annual Report Download - page 105
Download and view the complete annual report
Please find page 105 of the 2014 The Hartford annual report below. You can navigate through the pages in the report by either clicking on the pages listed below, or by using the keyword search tool below to find specific information within the annual report.-
 1
1 -
2
-
3
-
4
-
5
-
6
-
7
-
8
-
9
-
10
-
11
-
12
-
13
-
14
-
15
-
16
-
17
-
18
-
19
-
20
-
21
-
22
-
23
-
24
-
25
-
26
-
27
-
28
-
29
-
30
-
31
-
32
-
33
-
34
-
35
-
36
-
37
-
38
-
39
-
40
-
41
-
42
-
43
-
44
-
45
-
46
-
47
-
48
-
49
-
50
-
51
-
52
-
53
-
54
-
55
-
56
-
57
-
58
-
59
-
60
-
61
-
62
-
63
-
64
-
65
-
66
-
67
-
68
-
69
-
70
-
71
-
72
-
73
-
74
-
75
-
76
-
77
-
78
-
79
-
80
-
81
-
82
-
83
-
84
-
85
-
86
-
87
-
88
-
89
-
90
-
91
-
92
-
93
-
94
-
 95
95 -
 96
96 -
 97
97 -
 98
98 -
 99
99 -
 100
100 -
 101
101 -
 102
102 -
 103
103 -
 104
104 -
 105
105 -
 106
106 -
 107
107 -
 108
108 -
 109
109 -
 110
110 -
 111
111 -
 112
112 -
 113
113 -
 114
114 -
 115
115 -
116
-
117
-
118
-
119
-
120
-
121
-
122
-
123
-
124
-
125
-
126
-
127
-
128
-
129
-
130
-
131
-
132
-
133
-
134
-
135
-
136
-
137
-
138
-
139
-
140
-
141
-
142
-
143
-
144
-
145
-
146
-
147
-
148
-
149
-
150
-
151
-
152
-
153
-
154
-
155
-
156
-
157
-
158
-
159
-
160
-
161
-
162
-
163
-
164
-
165
-
166
-
167
-
168
-
169
-
170
-
171
-
172
-
173
-
174
-
175
-
176
-
177
-
178
-
179
-
180
-
181
-
182
-
183
-
184
-
185
-
186
-
187
-
188
-
189
-
190
-
191
-
192
-
193
-
194
-
195
-
196
-
197
-
198
-
199
-
200
-
201
-
202
-
203
-
204
-
205
-
206
-
207
-
208
-
209
-
210
-
211
-
212
-
213
-
214
-
215
-
216
-
217
-
218
-
219
-
220
-
221
-
222
-
223
-
224
-
225
-
226
-
227
-
228
-
229
-
230
-
231
-
232
-
233
-
234
-
235
-
236
-
237
-
238
-
239
-
240
-
241
-
242
-
243
-
244
-
245
-
246
-
247
-
248
-
249
-
250
-
251
-
252
-
253
-
254
-
255
-
256
-
257
-
258
-
259
-
260
-
261
-
262
-
263
-
264
-
265
-
266
-
267
-
268
-
269
-
270
-
271
-
272
-
273
-
274
-
275
-
276
-
277
-
278
-
279
-
280
-
281
-
282
-
283
-
284
-
285
-
286
-
287
-
288
-
289
-
290
-
291
-
292
-
293
-
294
-
295
-
296
 |
 |

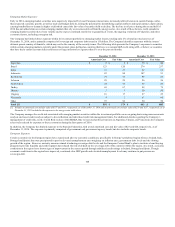
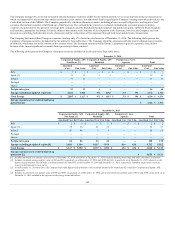
In addition to counterparty credit risk, the Company may also introduce credit risk through the use of credit default swaps that are entered into to manage
credit exposure. Credit default swaps involve a transfer of credit risk of one or many referenced entities from one party to another in exchange for periodic
payments. The party that purchases credit protection will make periodic payments based on an agreed upon rate and notional amount, and for certain
transactions there will also be an upfront premium payment. The second party, who assumes credit risk, will typically only make a payment if there is a credit
event as defined in the contract and such payment will be typically equal to the notional value of the swap contract less the value of the referenced security
issuer’s debt obligation. A credit event is generally defined as default on contractually obligated interest or principal payments or bankruptcy of the
referenced entity.
The Company uses credit derivatives to purchase credit protection and to assume credit risk with respect to a single entity, referenced index, or asset pool.
The Company purchases credit protection through credit default swaps to economically hedge and manage credit risk of certain fixed maturity investments
across multiple sectors of the investment portfolio. The Company also enters into credit default swaps that assume credit risk as part of replication
transactions. Replication transactions are used as an economical means to synthetically replicate the characteristics and performance of assets that are
permissible investments under the Company’s investment policies. These swaps reference investment grade single corporate issuers and baskets, which
include customized diversified portfolios of corporate issuers, which are established within sector concentration limits and may be divided into tranches
which possess different credit ratings.
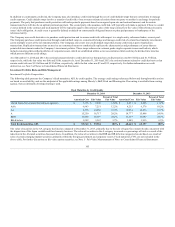
As of December 31, 2014 and 2013, the notional amount related to credit derivatives that purchase credit protection was $0.6 billion and $1.3 billion,
respectively, while the fair value was $(6) and $(10), respectively. As of December 31, 2014 and 2013, the notional amount related to credit derivatives that
assume credit risk was $1.5 billion and $1.9 billion, respectively, while the fair value was $3 and $33, respectively. For further information on credit
derivatives, see Note 6 of Notes to Consolidated Financial Statements.
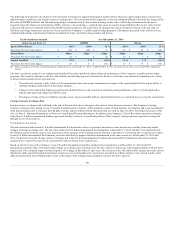
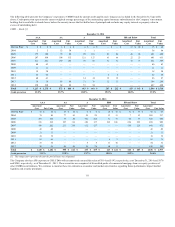
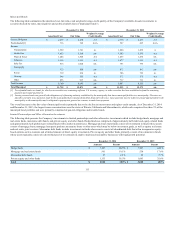
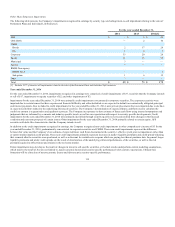
Investment Portfolio Composition
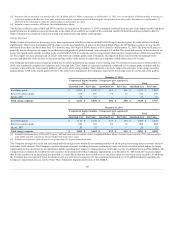
The following table presents the Company’s fixed maturities, AFS, by credit quality. The average credit ratings referenced below and throughout this section
are based on availability, and are the midpoint of the applicable ratings among Moody’s, S&P, Fitch and Morningstar. If no rating is available from a rating
agency, then an internally developed rating is used.
United States Government/Government agencies $ 7,135 $ 7,596 12.8% $ 8,231 $ 8,208 13.2%
AAA 6,963 7,251 12.2% 6,215 6,376 10.2%
AA 9,258 10,056 16.9% 12,054 12,273 19.7%
A 15,250 16,717 28.2% 14,777 15,498 24.9%
BBB 13,464 14,397 24.2% 15,555 16,087 25.7%
BB & below 3,292 3,367 5.7% 3,809 3,915 6.3%
The value of securities in the AA category declined as compared to December 31, 2013, primarily due to the sale of Japan Government bonds concurrent with
the disposition of the Japan variable and fixed annuity business. The value of securities in the A category increased as a percentage of total as a result of the
reduction in the AA rated securities discussed above. In addition, the value of securities in the BBB and BB & below categories has declined, as a result of
sales of certain emerging market securities, primarily within the foreign government and corporate sectors. Fixed maturities, FVO, are not included in the
above table. For further discussion on fair value option securities, see Note 5 - Fair Value Measurements of Notes to Consolidated Financial Statements.
105