The Hartford 2014 Annual Report Download - page 182
Download and view the complete annual report
Please find page 182 of the 2014 The Hartford annual report below. You can navigate through the pages in the report by either clicking on the pages listed below, or by using the keyword search tool below to find specific information within the annual report.-
 1
1 -
2
-
3
-
4
-
5
-
6
-
7
-
8
-
9
-
10
-
11
-
12
-
13
-
14
-
15
-
16
-
17
-
18
-
19
-
20
-
21
-
22
-
23
-
24
-
25
-
26
-
27
-
28
-
29
-
30
-
31
-
32
-
33
-
34
-
35
-
36
-
37
-
38
-
39
-
40
-
41
-
42
-
43
-
44
-
45
-
46
-
47
-
48
-
49
-
50
-
51
-
52
-
53
-
54
-
55
-
56
-
57
-
58
-
59
-
60
-
61
-
62
-
63
-
64
-
65
-
66
-
67
-
68
-
69
-
70
-
71
-
72
-
73
-
74
-
75
-
76
-
77
-
78
-
79
-
80
-
81
-
82
-
83
-
84
-
85
-
86
-
87
-
88
-
89
-
90
-
91
-
92
-
93
-
94
-
95
-
96
-
97
-
98
-
99
-
100
-
101
-
102
-
103
-
104
-
105
-
106
-
107
-
108
-
109
-
110
-
111
-
112
-
113
-
114
-
115
-
116
-
117
-
118
-
119
-
120
-
121
-
122
-
123
-
124
-
125
-
126
-
127
-
128
-
129
-
130
-
131
-
132
-
133
-
134
-
135
-
136
-
137
-
138
-
139
-
140
-
141
-
142
-
143
-
144
-
145
-
146
-
147
-
148
-
149
-
150
-
151
-
152
-
153
-
154
-
155
-
156
-
157
-
158
-
159
-
160
-
161
-
162
-
163
-
164
-
165
-
166
-
167
-
168
-
169
-
170
-
171
-
 172
172 -
 173
173 -
 174
174 -
 175
175 -
 176
176 -
 177
177 -
 178
178 -
 179
179 -
 180
180 -
 181
181 -
 182
182 -
 183
183 -
 184
184 -
 185
185 -
 186
186 -
 187
187 -
 188
188 -
 189
189 -
 190
190 -
 191
191 -
 192
192 -
193
-
194
-
195
-
196
-
197
-
198
-
199
-
200
-
201
-
202
-
203
-
204
-
205
-
206
-
207
-
208
-
209
-
210
-
211
-
212
-
213
-
214
-
215
-
216
-
217
-
218
-
219
-
220
-
221
-
222
-
223
-
224
-
225
-
226
-
227
-
228
-
229
-
230
-
231
-
232
-
233
-
234
-
235
-
236
-
237
-
238
-
239
-
240
-
241
-
242
-
243
-
244
-
245
-
246
-
247
-
248
-
249
-
250
-
251
-
252
-
253
-
254
-
255
-
256
-
257
-
258
-
259
-
260
-
261
-
262
-
263
-
264
-
265
-
266
-
267
-
268
-
269
-
270
-
271
-
272
-
273
-
274
-
275
-
276
-
277
-
278
-
279
-
280
-
281
-
282
-
283
-
284
-
285
-
286
-
287
-
288
-
289
-
290
-
291
-
292
-
293
-
294
-
295
-
296
 |
 |

Table of Contents
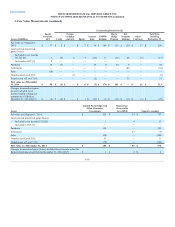
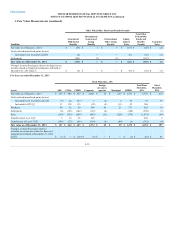
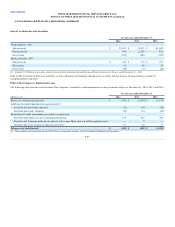
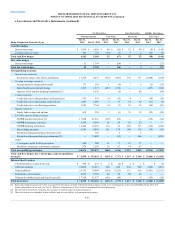
The following table presents the Company’s AFS securities by type.
ABS $ 2,470 $ 39 $ (37) $ 2,472 $ (1) $ 2,404 $ 25 $ (64) $ 2,365 $ (2)
CDOs [2] 2,776 98 (36) 2,841 — 2,340 108 (59) 2,387 —
CMBS 4,235 196 (16) 4,415 (6) 4,288 216 (58) 4,446 (6)
Corporate 25,188 2,382 (211) 27,359 (3) 27,013 1,823 (346) 28,490 (7)
Foreign govt./govt. agencies 1,592 73 (29) 1,636 — 4,228 52 (176) 4,104 —
Municipal 11,735 1,141 (5) 12,871 — 11,932 425 (184) 12,173 —
RMBS 3,815 122 (19) 3,918 (1) 4,639 90 (82) 4,647 (4)
U.S. Treasuries 3,551 326 (5) 3,872 — 3,797 7 (59) 3,745 —
Equity securities, AFS [3] 676 50 (27) 699 — 850 67 (49) 868 —
[1] Represents the amount of cumulative non-credit OTTI losses recognized in OCI on securities that also had credit impairments. These losses are included in gross unrealized
losses as of December 31, 2014 and 2013.
[2] Gross unrealized gains (losses) exclude the fair value of bifurcated embedded derivative features of certain securities. Subsequent changes in value will be recorded in net
realized capital gains (losses).
[3] As of December 31, 2014, excludes equity securities, FVO, with a cost of $351 and fair value of $348, which are included in equity securities, AFS on the Consolidated
Balance Sheets.
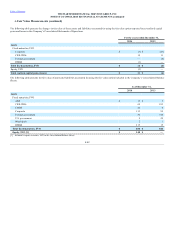
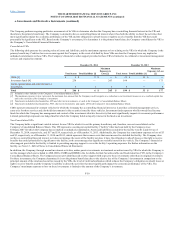
The following table presents the Company’s fixed maturities, AFS, by contractual maturity year.
One year or less $ 2,141 $ 2,168 $ 2,195 $ 2,228
Over one year through five years 11,264 11,827 11,930 12,470
Over five years through ten years 8,802 9,226 10,814 11,183
Over ten years 19,859 22,517 22,031 22,631
Subtotal 42,066 45,738 46,970 48,512
Mortgage-backed and asset-backed securities 13,296 13,646 13,671 13,845
Estimated maturities may differ from contractual maturities due to security call or prepayment provisions. Due to the potential for variability in payment
spreads (i.e. prepayments or extensions), mortgage-backed and asset-backed securities are not categorized by contractual maturity.
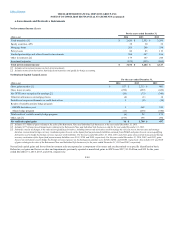
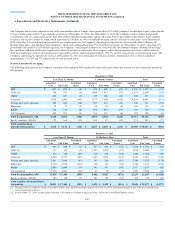
The Company aims to maintain a diversified investment portfolio including issuer, sector and geographic stratification, where applicable, and has established
certain exposure limits, diversification standards and review procedures to mitigate credit risk.
F-46