The Hartford 2014 Annual Report Download - page 227
Download and view the complete annual report
Please find page 227 of the 2014 The Hartford annual report below. You can navigate through the pages in the report by either clicking on the pages listed below, or by using the keyword search tool below to find specific information within the annual report.-
 1
1 -
2
-
3
-
4
-
5
-
6
-
7
-
8
-
9
-
10
-
11
-
12
-
13
-
14
-
15
-
16
-
17
-
18
-
19
-
20
-
21
-
22
-
23
-
24
-
25
-
26
-
27
-
28
-
29
-
30
-
31
-
32
-
33
-
34
-
35
-
36
-
37
-
38
-
39
-
40
-
41
-
42
-
43
-
44
-
45
-
46
-
47
-
48
-
49
-
50
-
51
-
52
-
53
-
54
-
55
-
56
-
57
-
58
-
59
-
60
-
61
-
62
-
63
-
64
-
65
-
66
-
67
-
68
-
69
-
70
-
71
-
72
-
73
-
74
-
75
-
76
-
77
-
78
-
79
-
80
-
81
-
82
-
83
-
84
-
85
-
86
-
87
-
88
-
89
-
90
-
91
-
92
-
93
-
94
-
95
-
96
-
97
-
98
-
99
-
100
-
101
-
102
-
103
-
104
-
105
-
106
-
107
-
108
-
109
-
110
-
111
-
112
-
113
-
114
-
115
-
116
-
117
-
118
-
119
-
120
-
121
-
122
-
123
-
124
-
125
-
126
-
127
-
128
-
129
-
130
-
131
-
132
-
133
-
134
-
135
-
136
-
137
-
138
-
139
-
140
-
141
-
142
-
143
-
144
-
145
-
146
-
147
-
148
-
149
-
150
-
151
-
152
-
153
-
154
-
155
-
156
-
157
-
158
-
159
-
160
-
161
-
162
-
163
-
164
-
165
-
166
-
167
-
168
-
169
-
170
-
171
-
172
-
173
-
174
-
175
-
176
-
177
-
178
-
179
-
180
-
181
-
182
-
183
-
184
-
185
-
186
-
187
-
188
-
189
-
190
-
191
-
192
-
193
-
194
-
195
-
196
-
197
-
198
-
199
-
200
-
201
-
202
-
203
-
204
-
205
-
206
-
207
-
208
-
209
-
210
-
211
-
212
-
213
-
214
-
215
-
216
-
 217
217 -
 218
218 -
 219
219 -
 220
220 -
 221
221 -
 222
222 -
 223
223 -
 224
224 -
 225
225 -
 226
226 -
 227
227 -
 228
228 -
 229
229 -
 230
230 -
 231
231 -
 232
232 -
 233
233 -
 234
234 -
 235
235 -
 236
236 -
 237
237 -
238
-
239
-
240
-
241
-
242
-
243
-
244
-
245
-
246
-
247
-
248
-
249
-
250
-
251
-
252
-
253
-
254
-
255
-
256
-
257
-
258
-
259
-
260
-
261
-
262
-
263
-
264
-
265
-
266
-
267
-
268
-
269
-
270
-
271
-
272
-
273
-
274
-
275
-
276
-
277
-
278
-
279
-
280
-
281
-
282
-
283
-
284
-
285
-
286
-
287
-
288
-
289
-
290
-
291
-
292
-
293
-
294
-
295
-
296
 |
 |
Table of Contents
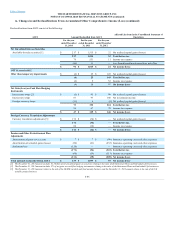
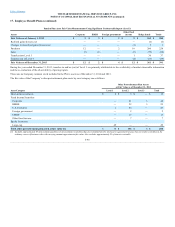
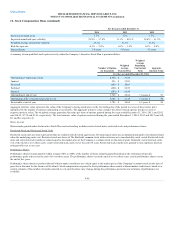
The Company’s pension plan and other postretirement benefit plans’ target allocation by asset category is presented in the table below.
(minimum) (maximum) (minimum) (maximum)
Equity securities 10% 25% 15% 35%
Fixed income securities 50% 70% 65% 85%
Alternative assets 10% 25% —% —%
Divergent market performance among different asset classes may, from time to time, cause the asset allocation to deviate from the desired asset allocation
ranges. The asset allocation mix is reviewed on a periodic basis. If it is determined that an asset allocation mix rebalancing is required, future portfolio
additions and withdrawals will be used, as necessary, to bring the allocation within tactical ranges.
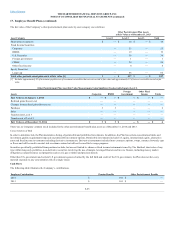
The Company’s pension plan and other postretirement benefit plans’ weighted average asset allocation is presented in the table below.
Equity securities 21% 23% 25% 31%
Fixed income securities 62% 57% 75% 68%
Alternative assets 17% 20% —% 1%
The Plan assets are invested primarily in separate portfolios managed by HIMCO, a wholly-owned subsidiary of the Company, except for the international
equity assets which are managed by a major financial institution. These portfolios encompass multiple asset classes reflecting the current needs of the Plan,
the investment preferences and risk tolerance of the Plan and the desired degree of diversification. These asset classes include publicly traded equities, bonds
and alternative investments and are made up of individual investments in cash and cash equivalents, equity securities, debt securities, asset-backed securities
and hedge funds. Hedge fund investments represent a diversified portfolio of partnership investments in absolute-return investment strategies.
In addition, the Company uses U.S. Treasury bond futures contracts and U.S. Treasury STRIPS in a duration overlay program to adjust the duration of Plan
assets to better match the duration of the benefit obligation.
Investment Valuation
For further discussion of the valuation of investments, see Note 5 - Fair Value Measurements of Notes to Consolidated Financial Statements.
F-91