The Hartford 2014 Annual Report Download - page 211
Download and view the complete annual report
Please find page 211 of the 2014 The Hartford annual report below. You can navigate through the pages in the report by either clicking on the pages listed below, or by using the keyword search tool below to find specific information within the annual report.-
 1
1 -
2
-
3
-
4
-
5
-
6
-
7
-
8
-
9
-
10
-
11
-
12
-
13
-
14
-
15
-
16
-
17
-
18
-
19
-
20
-
21
-
22
-
23
-
24
-
25
-
26
-
27
-
28
-
29
-
30
-
31
-
32
-
33
-
34
-
35
-
36
-
37
-
38
-
39
-
40
-
41
-
42
-
43
-
44
-
45
-
46
-
47
-
48
-
49
-
50
-
51
-
52
-
53
-
54
-
55
-
56
-
57
-
58
-
59
-
60
-
61
-
62
-
63
-
64
-
65
-
66
-
67
-
68
-
69
-
70
-
71
-
72
-
73
-
74
-
75
-
76
-
77
-
78
-
79
-
80
-
81
-
82
-
83
-
84
-
85
-
86
-
87
-
88
-
89
-
90
-
91
-
92
-
93
-
94
-
95
-
96
-
97
-
98
-
99
-
100
-
101
-
102
-
103
-
104
-
105
-
106
-
107
-
108
-
109
-
110
-
111
-
112
-
113
-
114
-
115
-
116
-
117
-
118
-
119
-
120
-
121
-
122
-
123
-
124
-
125
-
126
-
127
-
128
-
129
-
130
-
131
-
132
-
133
-
134
-
135
-
136
-
137
-
138
-
139
-
140
-
141
-
142
-
143
-
144
-
145
-
146
-
147
-
148
-
149
-
150
-
151
-
152
-
153
-
154
-
155
-
156
-
157
-
158
-
159
-
160
-
161
-
162
-
163
-
164
-
165
-
166
-
167
-
168
-
169
-
170
-
171
-
172
-
173
-
174
-
175
-
176
-
177
-
178
-
179
-
180
-
181
-
182
-
183
-
184
-
185
-
186
-
187
-
188
-
189
-
190
-
191
-
192
-
193
-
194
-
195
-
196
-
197
-
198
-
199
-
200
-
 201
201 -
 202
202 -
 203
203 -
 204
204 -
 205
205 -
 206
206 -
 207
207 -
 208
208 -
 209
209 -
 210
210 -
 211
211 -
 212
212 -
 213
213 -
 214
214 -
 215
215 -
 216
216 -
 217
217 -
 218
218 -
 219
219 -
 220
220 -
 221
221 -
222
-
223
-
224
-
225
-
226
-
227
-
228
-
229
-
230
-
231
-
232
-
233
-
234
-
235
-
236
-
237
-
238
-
239
-
240
-
241
-
242
-
243
-
244
-
245
-
246
-
247
-
248
-
249
-
250
-
251
-
252
-
253
-
254
-
255
-
256
-
257
-
258
-
259
-
260
-
261
-
262
-
263
-
264
-
265
-
266
-
267
-
268
-
269
-
270
-
271
-
272
-
273
-
274
-
275
-
276
-
277
-
278
-
279
-
280
-
281
-
282
-
283
-
284
-
285
-
286
-
287
-
288
-
289
-
290
-
291
-
292
-
293
-
294
-
295
-
296
 |
 |

Table of Contents
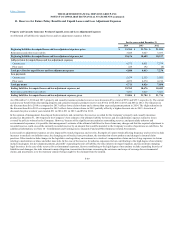
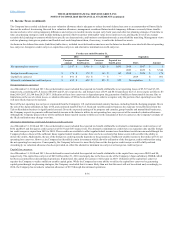
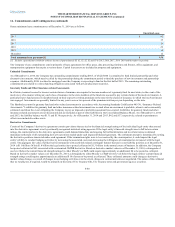
The Company and its subsidiaries file income tax returns in the U.S. federal jurisdiction, and various state and foreign jurisdictions, as applicable. Income
(loss) from continuing operations before income taxes included income (loss) from domestic operations of $1,736, $1,473 and $(106) for the years ended
December 31, 2014, 2013 and 2012, and income (loss) from foreign operations of $(37), $(2) and $17 for the years ended December 31, 2014, 2013 and 2012.
The provision (benefit) for income taxes consists of the following:
Current - U.S. Federal $ (62) $ 219 $ 33
International 2 — —
Deferred - U.S. Federal 410 27 (342)
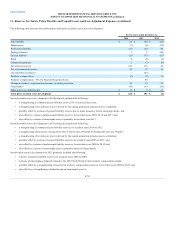
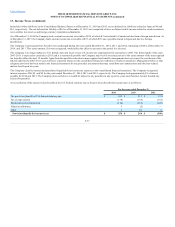
Deferred tax assets and liabilities on the consolidated balance sheets represent the tax consequences of differences between the financial reporting and tax
basis of assets and liabilities.
Deferred tax assets (liabilities) include the following:
Tax discount on loss reserves $ 573 $ 632
Tax basis deferred policy acquisition costs 163 207
Unearned premium reserve and other underwriting related reserves 456 434
Investment-related items [1] 1,020 1,641
Insurance product derivatives 44 13
Employee benefits 677 523
Alternative minimum tax credit 652 823
Net operating loss carryover [1] 1,936 1,093
Foreign tax credit carryover 178 163
Capital loss carryover 172 —
Other — 63
Valuation Allowance (181) (4)
Financial statement deferred policy acquisition costs and reserves (1,040) (894)
Net unrealized gains on investments (1,489) (669)
Other depreciable and amortizable assets (217) (185)
Other (47) —
[1] On July 18, 2014, the U.S. Internal Revenue Service issued Internal Revenue Code Section 446 Directive (“the Directive”) regarding the tax treatment of hedging gains and
losses related to the hedging of variable annuity guaranteed minimum benefits such as contracts with GMDB and GMWB riders. The Directive accelerated the tax deduction
related to previously deferred investment hedging losses. While the acceleration did not have a material effect on the Company’s overall consolidated deferred tax asset, the
Directive resulted in a re-characterization of deferred tax assets. The changes were a decrease in temporary differences for investment-related items and an increase in net
operating loss carryover.
F-75