The Hartford 2014 Annual Report Download - page 239
Download and view the complete annual report
Please find page 239 of the 2014 The Hartford annual report below. You can navigate through the pages in the report by either clicking on the pages listed below, or by using the keyword search tool below to find specific information within the annual report.-
 1
1 -
2
-
3
-
4
-
5
-
6
-
7
-
8
-
9
-
10
-
11
-
12
-
13
-
14
-
15
-
16
-
17
-
18
-
19
-
20
-
21
-
22
-
23
-
24
-
25
-
26
-
27
-
28
-
29
-
30
-
31
-
32
-
33
-
34
-
35
-
36
-
37
-
38
-
39
-
40
-
41
-
42
-
43
-
44
-
45
-
46
-
47
-
48
-
49
-
50
-
51
-
52
-
53
-
54
-
55
-
56
-
57
-
58
-
59
-
60
-
61
-
62
-
63
-
64
-
65
-
66
-
67
-
68
-
69
-
70
-
71
-
72
-
73
-
74
-
75
-
76
-
77
-
78
-
79
-
80
-
81
-
82
-
83
-
84
-
85
-
86
-
87
-
88
-
89
-
90
-
91
-
92
-
93
-
94
-
95
-
96
-
97
-
98
-
99
-
100
-
101
-
102
-
103
-
104
-
105
-
106
-
107
-
108
-
109
-
110
-
111
-
112
-
113
-
114
-
115
-
116
-
117
-
118
-
119
-
120
-
121
-
122
-
123
-
124
-
125
-
126
-
127
-
128
-
129
-
130
-
131
-
132
-
133
-
134
-
135
-
136
-
137
-
138
-
139
-
140
-
141
-
142
-
143
-
144
-
145
-
146
-
147
-
148
-
149
-
150
-
151
-
152
-
153
-
154
-
155
-
156
-
157
-
158
-
159
-
160
-
161
-
162
-
163
-
164
-
165
-
166
-
167
-
168
-
169
-
170
-
171
-
172
-
173
-
174
-
175
-
176
-
177
-
178
-
179
-
180
-
181
-
182
-
183
-
184
-
185
-
186
-
187
-
188
-
189
-
190
-
191
-
192
-
193
-
194
-
195
-
196
-
197
-
198
-
199
-
200
-
201
-
202
-
203
-
204
-
205
-
206
-
207
-
208
-
209
-
210
-
211
-
212
-
213
-
214
-
215
-
216
-
217
-
218
-
219
-
220
-
221
-
222
-
223
-
224
-
225
-
226
-
227
-
228
-
 229
229 -
 230
230 -
 231
231 -
 232
232 -
 233
233 -
 234
234 -
 235
235 -
 236
236 -
 237
237 -
 238
238 -
 239
239 -
 240
240 -
 241
241 -
 242
242 -
 243
243 -
 244
244 -
 245
245 -
 246
246 -
 247
247 -
 248
248 -
 249
249 -
250
-
251
-
252
-
253
-
254
-
255
-
256
-
257
-
258
-
259
-
260
-
261
-
262
-
263
-
264
-
265
-
266
-
267
-
268
-
269
-
270
-
271
-
272
-
273
-
274
-
275
-
276
-
277
-
278
-
279
-
280
-
281
-
282
-
283
-
284
-
285
-
286
-
287
-
288
-
289
-
290
-
291
-
292
-
293
-
294
-
295
-
296
 |
 |

Table of Contents
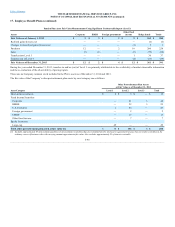
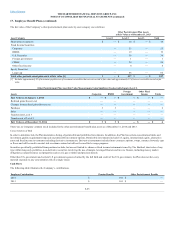
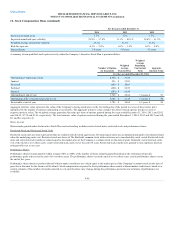
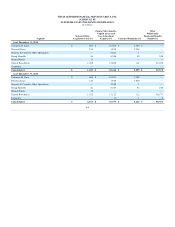
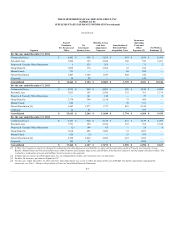
The tables below provide roll-forwards for accrued restructuring and other costs included in other liabilities in the Consolidated Balance Sheets.
$ 22 $ — $ — $ 6 $ 28
Accruals/provisions 16 — 43 12 71
Payments/write-offs (28) — (43) (12) (83)
$ 70 $ — $ — $ — $ 70
Accruals/provisions 22 19 20 6 67
Payments/write-offs (70) (19) (20) — (109)
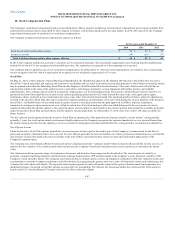
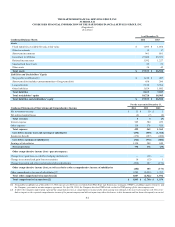
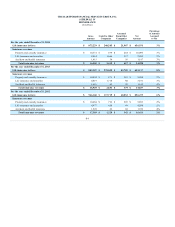
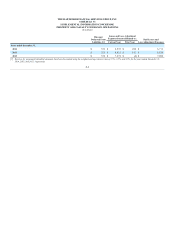
Revenues $ 4,612 $ 6,300 $ 4,616 $ 4,734 $ 4,769 $ 4,862 $ 4,617 $ 4,777
Benefits, losses and expenses 4,003 5,994 4,466 4,497 4,273 4,416 4,173 4,295
Income from continuing operations, net of tax 466 243 150 233 388 365 345 384
Income (loss) from discontinued operations, net of tax 29 (484) (617) (423) — (72) 37 (70)
Net income (loss) 495 (241) (467) (190) 388 293 382 314
Less: Preferred stock dividends and discount accretion — 10 — — — — — —
Net income (loss) available to common shareholders [1] $ 495 $ (251) $ (467) $ (190) $ 388 $ 293 $ 382 $ 314
Basic earnings (losses) per common share $ 1.10 $ (0.58) $ (1.04) $ (0.42) $ 0.89 $ 0.65 $ 0.89 $ 0.70
Diluted earnings (losses) per common share $ 1.03 $ (0.49) $ (1.00) $ (0.39) $ 0.86 $ 0.60 $ 0.86 $ 0.65
Weighted average common shares outstanding, basic 449.8 436.3 450.6 451.4 437.2 452.1 429.6 451.1
Weighted average shares outstanding and dilutive potential
common shares [2] 478.6 493.1 467.9 489.0 450.8 490.6 442.6 486.1
[1] Weighted average common shares outstanding and dilutive potential common shares are used in the calculation of diluted earnings (losses) per common share in periods of
losses when the impact is dilutive to income from continuing operations, net of tax, available to common shareholders.
[2] The three months ended March 31, 2013 includes the dilutive effect of the assumed conversion of 21.2 million preferred shares. The preferred shares converted to 21.2
million common shares in April 2013.
F-103