The Hartford 2014 Annual Report Download - page 79
Download and view the complete annual report
Please find page 79 of the 2014 The Hartford annual report below. You can navigate through the pages in the report by either clicking on the pages listed below, or by using the keyword search tool below to find specific information within the annual report.-
 1
1 -
2
-
3
-
4
-
5
-
6
-
7
-
8
-
9
-
10
-
11
-
12
-
13
-
14
-
15
-
16
-
17
-
18
-
19
-
20
-
21
-
22
-
23
-
24
-
25
-
26
-
27
-
28
-
29
-
30
-
31
-
32
-
33
-
34
-
35
-
36
-
37
-
38
-
39
-
40
-
41
-
42
-
43
-
44
-
45
-
46
-
47
-
48
-
49
-
50
-
51
-
52
-
53
-
54
-
55
-
56
-
57
-
58
-
59
-
60
-
61
-
62
-
63
-
64
-
65
-
66
-
67
-
68
-
 69
69 -
 70
70 -
 71
71 -
 72
72 -
 73
73 -
 74
74 -
 75
75 -
 76
76 -
 77
77 -
 78
78 -
 79
79 -
 80
80 -
 81
81 -
 82
82 -
 83
83 -
 84
84 -
 85
85 -
 86
86 -
 87
87 -
 88
88 -
 89
89 -
90
-
91
-
92
-
93
-
94
-
95
-
96
-
97
-
98
-
99
-
100
-
101
-
102
-
103
-
104
-
105
-
106
-
107
-
108
-
109
-
110
-
111
-
112
-
113
-
114
-
115
-
116
-
117
-
118
-
119
-
120
-
121
-
122
-
123
-
124
-
125
-
126
-
127
-
128
-
129
-
130
-
131
-
132
-
133
-
134
-
135
-
136
-
137
-
138
-
139
-
140
-
141
-
142
-
143
-
144
-
145
-
146
-
147
-
148
-
149
-
150
-
151
-
152
-
153
-
154
-
155
-
156
-
157
-
158
-
159
-
160
-
161
-
162
-
163
-
164
-
165
-
166
-
167
-
168
-
169
-
170
-
171
-
172
-
173
-
174
-
175
-
176
-
177
-
178
-
179
-
180
-
181
-
182
-
183
-
184
-
185
-
186
-
187
-
188
-
189
-
190
-
191
-
192
-
193
-
194
-
195
-
196
-
197
-
198
-
199
-
200
-
201
-
202
-
203
-
204
-
205
-
206
-
207
-
208
-
209
-
210
-
211
-
212
-
213
-
214
-
215
-
216
-
217
-
218
-
219
-
220
-
221
-
222
-
223
-
224
-
225
-
226
-
227
-
228
-
229
-
230
-
231
-
232
-
233
-
234
-
235
-
236
-
237
-
238
-
239
-
240
-
241
-
242
-
243
-
244
-
245
-
246
-
247
-
248
-
249
-
250
-
251
-
252
-
253
-
254
-
255
-
256
-
257
-
258
-
259
-
260
-
261
-
262
-
263
-
264
-
265
-
266
-
267
-
268
-
269
-
270
-
271
-
272
-
273
-
274
-
275
-
276
-
277
-
278
-
279
-
280
-
281
-
282
-
283
-
284
-
285
-
286
-
287
-
288
-
289
-
290
-
291
-
292
-
293
-
294
-
295
-
296
 |
 |

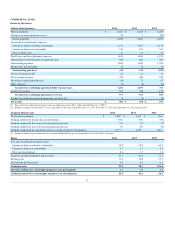
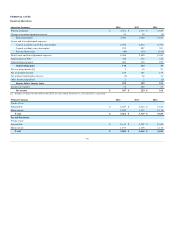
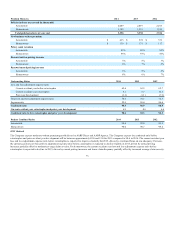
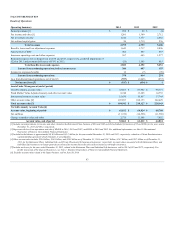
Results of Operations
Premiums and other considerations [1] $ 3,095 $ 3,330 $ 3,810
Net investment income 374 390 405
Net realized capital gains 15 50 40
Benefits, losses and loss adjustment expenses 2,362 2,518 3,029
Amortization of deferred policy acquisition costs 32 33 33
Insurance operating costs and other expenses 836 964 1,033
Income tax expense 63 63 31
Fully insured — ongoing premiums $ 3,014 $ 3,272 $ 3,745
Buyout premiums 20 1 3
Other 61 57 62
Group disability loss ratio 83.5% 84.0% 92.2%
Group life loss ratio 70.5% 69.5% 69.0%
Total loss ratio 76.2% 75.6% 79.5%
Expense ratio 28.2% 29.9% 28.0%
Group life loss ratio, excluding Association - Financial Institutions 72.8% 76.2% 77.1%
Total loss ratio, excluding Association - Financial Institutions 77.4% 79.3% 84.1%
Expense ratio, excluding Association - Financial Institutions 27.2% 26.8% 24.1%
Effect of net realized gains, net of tax on after-tax margin 0.3% 0.8% 0.6%
[1] Group Benefits has a block of Association - Financial Institution business that is subject to a profit sharing arrangement with third parties. The Association - Financial
Institutions business represented $72, $277 and $321 of premiums and other considerations, and $1, $1 and $2 of net income in 2014, 2013 and 2012, respectively.
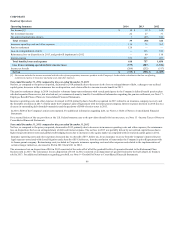
2015 Outlook
The Company expects premiums to increase for 2015 due primarily to higher expected sales than prior year and continued strong book persistency. The
Company expects Group Benefits' disability results to improve as a result of continued pricing actions, and lower incidence partially offset by lower life
results due to less favorable life mortality compared to 2014. The Company expects Group Benefits' after-tax core earnings margin (excluding buyouts) will
be between approximately 5.0% and 5.5% for 2015 as compared to 5.2% in 2014.
79