The Hartford 2014 Annual Report Download - page 71
Download and view the complete annual report
Please find page 71 of the 2014 The Hartford annual report below. You can navigate through the pages in the report by either clicking on the pages listed below, or by using the keyword search tool below to find specific information within the annual report.-
 1
1 -
2
-
3
-
4
-
5
-
6
-
7
-
8
-
9
-
10
-
11
-
12
-
13
-
14
-
15
-
16
-
17
-
18
-
19
-
20
-
21
-
22
-
23
-
24
-
25
-
26
-
27
-
28
-
29
-
30
-
31
-
32
-
33
-
34
-
35
-
36
-
37
-
38
-
39
-
40
-
41
-
42
-
43
-
44
-
45
-
46
-
47
-
48
-
49
-
50
-
51
-
52
-
53
-
54
-
55
-
56
-
57
-
58
-
59
-
60
-
 61
61 -
 62
62 -
 63
63 -
 64
64 -
 65
65 -
 66
66 -
 67
67 -
 68
68 -
 69
69 -
 70
70 -
 71
71 -
 72
72 -
 73
73 -
 74
74 -
 75
75 -
 76
76 -
 77
77 -
 78
78 -
 79
79 -
 80
80 -
 81
81 -
82
-
83
-
84
-
85
-
86
-
87
-
88
-
89
-
90
-
91
-
92
-
93
-
94
-
95
-
96
-
97
-
98
-
99
-
100
-
101
-
102
-
103
-
104
-
105
-
106
-
107
-
108
-
109
-
110
-
111
-
112
-
113
-
114
-
115
-
116
-
117
-
118
-
119
-
120
-
121
-
122
-
123
-
124
-
125
-
126
-
127
-
128
-
129
-
130
-
131
-
132
-
133
-
134
-
135
-
136
-
137
-
138
-
139
-
140
-
141
-
142
-
143
-
144
-
145
-
146
-
147
-
148
-
149
-
150
-
151
-
152
-
153
-
154
-
155
-
156
-
157
-
158
-
159
-
160
-
161
-
162
-
163
-
164
-
165
-
166
-
167
-
168
-
169
-
170
-
171
-
172
-
173
-
174
-
175
-
176
-
177
-
178
-
179
-
180
-
181
-
182
-
183
-
184
-
185
-
186
-
187
-
188
-
189
-
190
-
191
-
192
-
193
-
194
-
195
-
196
-
197
-
198
-
199
-
200
-
201
-
202
-
203
-
204
-
205
-
206
-
207
-
208
-
209
-
210
-
211
-
212
-
213
-
214
-
215
-
216
-
217
-
218
-
219
-
220
-
221
-
222
-
223
-
224
-
225
-
226
-
227
-
228
-
229
-
230
-
231
-
232
-
233
-
234
-
235
-
236
-
237
-
238
-
239
-
240
-
241
-
242
-
243
-
244
-
245
-
246
-
247
-
248
-
249
-
250
-
251
-
252
-
253
-
254
-
255
-
256
-
257
-
258
-
259
-
260
-
261
-
262
-
263
-
264
-
265
-
266
-
267
-
268
-
269
-
270
-
271
-
272
-
273
-
274
-
275
-
276
-
277
-
278
-
279
-
280
-
281
-
282
-
283
-
284
-
285
-
286
-
287
-
288
-
289
-
290
-
291
-
292
-
293
-
294
-
295
-
296
 |
 |

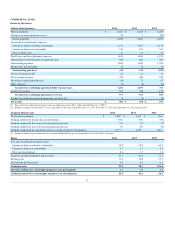
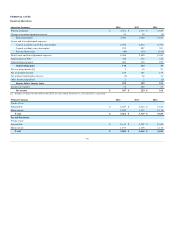
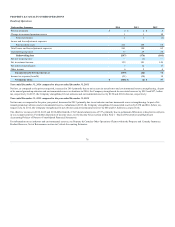
Results of Operations
Written premiums $ 6,381 $ 6,208 $ 6,209
Change in unearned premium reserve 92 5 (50)
Earned premiums 6,289 6,203 6,259
Losses and loss adjustment expenses
Current accident year before catastrophes 3,733 3,897 4,178
Current accident year catastrophes 109 105 325
Prior accident years 13 83 72
Total losses and loss adjustment expenses 3,855 4,085 4,575
Amortization of deferred policy acquisition costs 919 905 927
Underwriting expenses 1,086 1,082 1,034
Dividends to policyholders 15 16 14
Net servicing income [2] 23 21 17
Net investment income 958 984 924
Net realized capital gains (losses) (30) 72 67
Other expenses (3) (1) (6)
Income tax expense 385 320 159
Income (loss) from discontinued operations, net of tax [1] 6 (1) (5)
[1] Represents the residual income (loss) from operations and sale in 2011 of Specialty Risk Services (“SRS”).
[2] Includes servicing revenues of $113, $112, and $102 for the years ended December 31, 2014, December 31, 2013, and December 31, 2012 respectively.
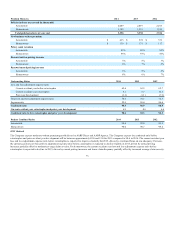
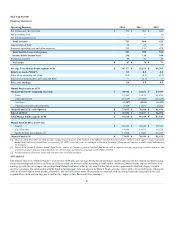
New business premium $ 1,088 $ 1,035 $ 968
Standard commercial lines policy count retention 84% 81% 83%
Standard commercial lines renewal written pricing increase 5% 7% 7%
Standard commercial lines renewal earned pricing increase 7% 8% 6%
Standard commercial lines policies in-force as of end of period (in thousands) 1,277 1,250 1,263
[1] Standard commercial premium measures exclude Middle Market specialty programs and livestock lines of business.
Loss and loss adjustment expense ratio
Current accident year before catastrophes 59.4 62.8 66.8
Current accident year catastrophes 1.7 1.7 5.2
Prior year development 0.2 1.3 1.2
Total loss and loss adjustment expense ratio 61.3 65.9 73.1
Expense ratio 31.9 32.0 31.3
Policyholder dividend ratio 0.2 0.3 0.2
1.9 3.0 6.4
71