The Hartford 2014 Annual Report Download - page 38
Download and view the complete annual report
Please find page 38 of the 2014 The Hartford annual report below. You can navigate through the pages in the report by either clicking on the pages listed below, or by using the keyword search tool below to find specific information within the annual report.-
 1
1 -
2
-
3
-
4
-
5
-
6
-
7
-
8
-
9
-
10
-
11
-
12
-
13
-
14
-
15
-
16
-
17
-
18
-
19
-
20
-
21
-
22
-
23
-
24
-
25
-
26
-
27
-
 28
28 -
 29
29 -
 30
30 -
 31
31 -
 32
32 -
 33
33 -
 34
34 -
 35
35 -
 36
36 -
 37
37 -
 38
38 -
 39
39 -
 40
40 -
 41
41 -
 42
42 -
 43
43 -
 44
44 -
 45
45 -
 46
46 -
 47
47 -
 48
48 -
49
-
50
-
51
-
52
-
53
-
54
-
55
-
56
-
57
-
58
-
59
-
60
-
61
-
62
-
63
-
64
-
65
-
66
-
67
-
68
-
69
-
70
-
71
-
72
-
73
-
74
-
75
-
76
-
77
-
78
-
79
-
80
-
81
-
82
-
83
-
84
-
85
-
86
-
87
-
88
-
89
-
90
-
91
-
92
-
93
-
94
-
95
-
96
-
97
-
98
-
99
-
100
-
101
-
102
-
103
-
104
-
105
-
106
-
107
-
108
-
109
-
110
-
111
-
112
-
113
-
114
-
115
-
116
-
117
-
118
-
119
-
120
-
121
-
122
-
123
-
124
-
125
-
126
-
127
-
128
-
129
-
130
-
131
-
132
-
133
-
134
-
135
-
136
-
137
-
138
-
139
-
140
-
141
-
142
-
143
-
144
-
145
-
146
-
147
-
148
-
149
-
150
-
151
-
152
-
153
-
154
-
155
-
156
-
157
-
158
-
159
-
160
-
161
-
162
-
163
-
164
-
165
-
166
-
167
-
168
-
169
-
170
-
171
-
172
-
173
-
174
-
175
-
176
-
177
-
178
-
179
-
180
-
181
-
182
-
183
-
184
-
185
-
186
-
187
-
188
-
189
-
190
-
191
-
192
-
193
-
194
-
195
-
196
-
197
-
198
-
199
-
200
-
201
-
202
-
203
-
204
-
205
-
206
-
207
-
208
-
209
-
210
-
211
-
212
-
213
-
214
-
215
-
216
-
217
-
218
-
219
-
220
-
221
-
222
-
223
-
224
-
225
-
226
-
227
-
228
-
229
-
230
-
231
-
232
-
233
-
234
-
235
-
236
-
237
-
238
-
239
-
240
-
241
-
242
-
243
-
244
-
245
-
246
-
247
-
248
-
249
-
250
-
251
-
252
-
253
-
254
-
255
-
256
-
257
-
258
-
259
-
260
-
261
-
262
-
263
-
264
-
265
-
266
-
267
-
268
-
269
-
270
-
271
-
272
-
273
-
274
-
275
-
276
-
277
-
278
-
279
-
280
-
281
-
282
-
283
-
284
-
285
-
286
-
287
-
288
-
289
-
290
-
291
-
292
-
293
-
294
-
295
-
296
 |
 |

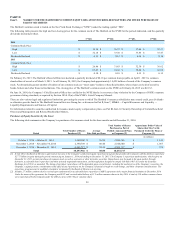
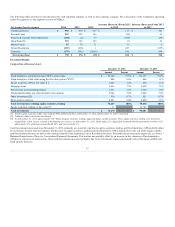
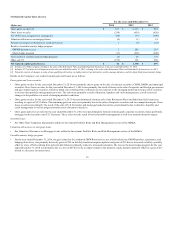
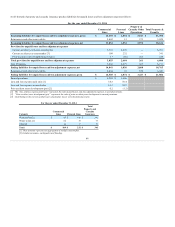
Net Investment Income (Loss)
(Before tax)
Fixed maturities [2] $ 2,420 4.2% $ 2,552 4.3% $ 3,299 4.4%
Equity securities, AFS 38 4.8% 30 3.6% 36 4.3%
Mortgage loans 265 4.7% 260 4.9% 334 5.2%
Policy loans 80 5.6% 83 5.9% 119 6.0%
Limited partnerships and other alternative investments 294 10.4% 287 9.5% 196 7.1%
Other investments [3] 179
167
248
Investment expense (122)
(115)
(105)
[1] Yields calculated using annualized net investment income divided by the monthly average invested assets at cost, amortized cost, or adjusted carrying value, as applicable,
excluding repurchase agreement collateral, if any, and derivatives book value. Yield calculations for each period exclude assets associated with the dispositions of the Japan
variable and fixed annuity business, the Retirement Plans and Individual Life businesses, and the Hartford Life International Limited business, as applicable.
[2] Includes net investment income on short-term investments.
[3] Primarily includes income from derivatives that qualify for hedge accounting and hedge fixed maturities.
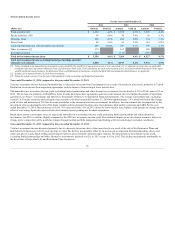
Year ended December 31, 2014 compared to the year ended December 31, 2013
Total net investment income decreased primarily due to a decrease in income from fixed maturities as a result of a decline in asset levels, primarily in Talcott
Resolution, lower income from repurchase agreements, and the impact of reinvesting at lower interest rates.
The annualized net investment income yield, excluding limited partnerships and other alternative investments, has declined to 4.1% in 2014 versus 4.2% in
2013. The decline was primarily attributable to lower income from repurchase agreements and lower reinvestment rates. For further discussion of repurchase
agreements, see Note 6 - Investments and Derivative Instruments of Notes to Consolidated Financial Statements. The average reinvestment rate, excluding
certain U.S. Treasury securities and cash equivalent securities, for the year ended December 31, 2014 was approximately 3.6% which was below the average
yield of sales and maturities of 3.9% for the same period due to the current interest rate environment. In addition, the reinvestment rate was impacted by the
investment of proceeds from the sale of the Japan variable and fixed annuity business into short duration, high quality corporates and ABS. For the year
ended December 31, 2014, the new money yield of 3.6% decreased from 3.8% in 2013 driven by lower interest rates, tighter credit spreads on average and the
effect of reinvesting Japan sales proceeds into short-duration assets pending use for share repurchases.
Based upon current reinvestment rates, we expect the annualized net investment income yield, excluding limited partnerships and other alternative
investments, for 2015, to decline slightly compared to the 2014 net investment income yield. The estimated impact on net investment income is subject to
change as the composition of the portfolio changes through normal portfolio management and trading activities and changes in market conditions.
Year ended December 31, 2013 compared to the year ended December 31, 2012
Total net investment income decreased primarily due to a decrease in income due to lower asset levels as a result of the sale of the Retirement Plans and
Individual Life businesses in 2013, and a decline in yield. The decline was partially offset by an increase in income from limited partnerships, due to real
estate and private equity funds selling underlying investments and continued valuation improvements. The annualized net investment income yield,
excluding limited partnerships and other alternative investments, declined to 4.2% in 2013 versus 4.5% in 2012. The decline was primarily attributable to
the divestiture of Individual Life and Retirement Plans businesses.
38