The Hartford 2014 Annual Report Download - page 176
Download and view the complete annual report
Please find page 176 of the 2014 The Hartford annual report below. You can navigate through the pages in the report by either clicking on the pages listed below, or by using the keyword search tool below to find specific information within the annual report.-
 1
1 -
2
-
3
-
4
-
5
-
6
-
7
-
8
-
9
-
10
-
11
-
12
-
13
-
14
-
15
-
16
-
17
-
18
-
19
-
20
-
21
-
22
-
23
-
24
-
25
-
26
-
27
-
28
-
29
-
30
-
31
-
32
-
33
-
34
-
35
-
36
-
37
-
38
-
39
-
40
-
41
-
42
-
43
-
44
-
45
-
46
-
47
-
48
-
49
-
50
-
51
-
52
-
53
-
54
-
55
-
56
-
57
-
58
-
59
-
60
-
61
-
62
-
63
-
64
-
65
-
66
-
67
-
68
-
69
-
70
-
71
-
72
-
73
-
74
-
75
-
76
-
77
-
78
-
79
-
80
-
81
-
82
-
83
-
84
-
85
-
86
-
87
-
88
-
89
-
90
-
91
-
92
-
93
-
94
-
95
-
96
-
97
-
98
-
99
-
100
-
101
-
102
-
103
-
104
-
105
-
106
-
107
-
108
-
109
-
110
-
111
-
112
-
113
-
114
-
115
-
116
-
117
-
118
-
119
-
120
-
121
-
122
-
123
-
124
-
125
-
126
-
127
-
128
-
129
-
130
-
131
-
132
-
133
-
134
-
135
-
136
-
137
-
138
-
139
-
140
-
141
-
142
-
143
-
144
-
145
-
146
-
147
-
148
-
149
-
150
-
151
-
152
-
153
-
154
-
155
-
156
-
157
-
158
-
159
-
160
-
161
-
162
-
163
-
164
-
165
-
 166
166 -
 167
167 -
 168
168 -
 169
169 -
 170
170 -
 171
171 -
 172
172 -
 173
173 -
 174
174 -
 175
175 -
 176
176 -
 177
177 -
 178
178 -
 179
179 -
 180
180 -
 181
181 -
 182
182 -
 183
183 -
 184
184 -
 185
185 -
 186
186 -
187
-
188
-
189
-
190
-
191
-
192
-
193
-
194
-
195
-
196
-
197
-
198
-
199
-
200
-
201
-
202
-
203
-
204
-
205
-
206
-
207
-
208
-
209
-
210
-
211
-
212
-
213
-
214
-
215
-
216
-
217
-
218
-
219
-
220
-
221
-
222
-
223
-
224
-
225
-
226
-
227
-
228
-
229
-
230
-
231
-
232
-
233
-
234
-
235
-
236
-
237
-
238
-
239
-
240
-
241
-
242
-
243
-
244
-
245
-
246
-
247
-
248
-
249
-
250
-
251
-
252
-
253
-
254
-
255
-
256
-
257
-
258
-
259
-
260
-
261
-
262
-
263
-
264
-
265
-
266
-
267
-
268
-
269
-
270
-
271
-
272
-
273
-
274
-
275
-
276
-
277
-
278
-
279
-
280
-
281
-
282
-
283
-
284
-
285
-
286
-
287
-
288
-
289
-
290
-
291
-
292
-
293
-
294
-
295
-
296
 |
 |
Table of Contents
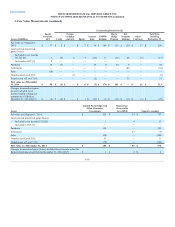
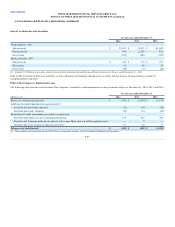
Fair value as of January 1, 2013 $ 84 $ 4 $ 57 $ (32) $ 519 $ 286 $ 68 $ 23 $ 925
Total realized/unrealized gains (losses)
Included in net income [1], [2], [6] (15) — (37) 24 (372) (191) (112) (6) (694)
Included in OCI [3] 6 — — — — — — — —
Purchases 14 — — (3) — 44 (38) — 3
Settlements — (2) (7) 3 (4) — (1) — (11)
Sales (3) — — — — — — — —
Transfers into Level 3 [4] — — — — — — (8) — (8)
Transfers out of Level 3 [4] (9) — (10) 26 3 — 62 — 81
Changes in unrealized gains (losses)
included in net income related to
financial instruments still held at
December 31, 2013 [2] [7] $ (15) $ (1) $ (22) $ 9 $ (390) $ (187) $ (382) $ (6) $ (979)
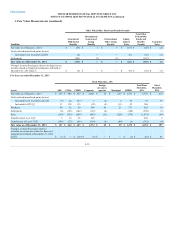
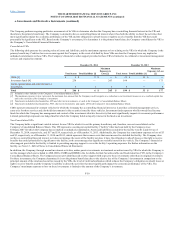
Fair value as of January 1, 2013 $ 314 $ 191 $ 583
Total realized/unrealized gains (losses)
Included in net income [1] [2] [6] (18) (192) 23
Purchases 135 — 250
Settlements — 30 (2)
Sales (22) — (88)
Transfers into Level 3 [4] — — 45
Transfers out of Level 3 [4] (301) — (74)
Changes in unrealized gains (losses) included in net income related to
financial instruments still held at December 31, 2013 [2] [7] $ (18) $ (192) $ 21
F-40