The Hartford 2014 Annual Report Download - page 35
Download and view the complete annual report
Please find page 35 of the 2014 The Hartford annual report below. You can navigate through the pages in the report by either clicking on the pages listed below, or by using the keyword search tool below to find specific information within the annual report.-
 1
1 -
2
-
3
-
4
-
5
-
6
-
7
-
8
-
9
-
10
-
11
-
12
-
13
-
14
-
15
-
16
-
17
-
18
-
19
-
20
-
21
-
22
-
23
-
24
-
 25
25 -
 26
26 -
 27
27 -
 28
28 -
 29
29 -
 30
30 -
 31
31 -
 32
32 -
 33
33 -
 34
34 -
 35
35 -
 36
36 -
 37
37 -
 38
38 -
 39
39 -
 40
40 -
 41
41 -
 42
42 -
 43
43 -
 44
44 -
 45
45 -
46
-
47
-
48
-
49
-
50
-
51
-
52
-
53
-
54
-
55
-
56
-
57
-
58
-
59
-
60
-
61
-
62
-
63
-
64
-
65
-
66
-
67
-
68
-
69
-
70
-
71
-
72
-
73
-
74
-
75
-
76
-
77
-
78
-
79
-
80
-
81
-
82
-
83
-
84
-
85
-
86
-
87
-
88
-
89
-
90
-
91
-
92
-
93
-
94
-
95
-
96
-
97
-
98
-
99
-
100
-
101
-
102
-
103
-
104
-
105
-
106
-
107
-
108
-
109
-
110
-
111
-
112
-
113
-
114
-
115
-
116
-
117
-
118
-
119
-
120
-
121
-
122
-
123
-
124
-
125
-
126
-
127
-
128
-
129
-
130
-
131
-
132
-
133
-
134
-
135
-
136
-
137
-
138
-
139
-
140
-
141
-
142
-
143
-
144
-
145
-
146
-
147
-
148
-
149
-
150
-
151
-
152
-
153
-
154
-
155
-
156
-
157
-
158
-
159
-
160
-
161
-
162
-
163
-
164
-
165
-
166
-
167
-
168
-
169
-
170
-
171
-
172
-
173
-
174
-
175
-
176
-
177
-
178
-
179
-
180
-
181
-
182
-
183
-
184
-
185
-
186
-
187
-
188
-
189
-
190
-
191
-
192
-
193
-
194
-
195
-
196
-
197
-
198
-
199
-
200
-
201
-
202
-
203
-
204
-
205
-
206
-
207
-
208
-
209
-
210
-
211
-
212
-
213
-
214
-
215
-
216
-
217
-
218
-
219
-
220
-
221
-
222
-
223
-
224
-
225
-
226
-
227
-
228
-
229
-
230
-
231
-
232
-
233
-
234
-
235
-
236
-
237
-
238
-
239
-
240
-
241
-
242
-
243
-
244
-
245
-
246
-
247
-
248
-
249
-
250
-
251
-
252
-
253
-
254
-
255
-
256
-
257
-
258
-
259
-
260
-
261
-
262
-
263
-
264
-
265
-
266
-
267
-
268
-
269
-
270
-
271
-
272
-
273
-
274
-
275
-
276
-
277
-
278
-
279
-
280
-
281
-
282
-
283
-
284
-
285
-
286
-
287
-
288
-
289
-
290
-
291
-
292
-
293
-
294
-
295
-
296
 |
 |

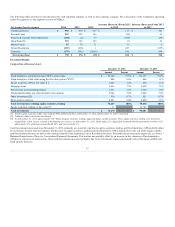
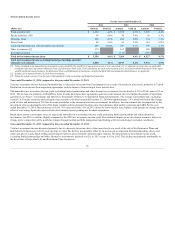
The Consolidated Results of Operations should be read in conjunction with the Company's Consolidated Financial Statements and the related Notes
beginning on page F-1.
Earned premiums $ 13,231 $ 13,637 $105 $(406)
Fee income 2,105 3,567 (109) (1,462)
Net investment income 3,264 4,127 (110) (863)
Net realized capital gains [1] 1,798 497 (1,782) 1,301
Other revenues 275 258 (163) 17
20,673 22,086 (2,059) (1,413)
Benefits, losses and loss adjustment expenses 11,048 13,195 (243) (2,147)
Amortization of deferred policy acquisition costs and present value of future
profits 1,794 1,990 (65) (196)
Insurance operating costs and other expenses 4,176 5,090 (148) (914)
Loss on extinguishment of debt 213 910 (213) (697)
Reinsurance (gain) loss on disposition in 2014 and 2013, goodwill
impairment of $342 in 2012 and premium deficiency of $191 in 2012 1,574 533 (1,597) 1,041
Interest expense 397 457 (21) (60)
19,202 22,175 (2,287) (2,973)
1,471 (89) 228 1,560
Income tax expense (benefit) 246 (309) 104 555
1,225 220 124 1,005
Loss from discontinued operations, net of tax (1,049) (258) 498 (791)
$ 176 $ (38) $622 $214
[1] Includes net realized capital gains in 2013 of $1,575 on investments transferred at fair value in business disposition by reinsurance.
Year ended December 31, 2014 compared to the year ended December 31, 2013
The increase in net income from 2013 to 2014 was primarily due to the net effect of the following items:
• A decrease in the loss from discontinued operations to $551, net of tax, compared to $1,049, net of tax, in 2013. The loss from discontinued operations
in 2014 includes the results of operations of the Japan business and the realized capital loss on the sale of HLIKK. The loss from discontinued
operations in 2013 includes the results of operations of the Japan and U.K. annuity businesses and the realized capital loss on the sale of HLIL. The
results of operations for the Japan annuity business in 2013 include the write-off of DAC and higher hedging losses. For further discussion of the sale of
these businesses, see Note 2 - Business Dispositions and Note 19 - Discontinued Operations of Notes to Consolidated Financial Statements.
• A $299 before tax improvement in current accident year underwriting results before catastrophes in Property & Casualty resulting in a 2.9 point
decrease in the combined ratio before catastrophes and prior year development. Also contributing to the improvement in underwriting results was an
increase in earned premiums of 2% or $232, before tax, in 2014, compared to 2013, reflecting earned premium growth of 1% in Commercial Lines and
4% in Personal Lines. For a discussion of the Company's operating results by segment, see the segment sections of MD&A.
• A loss on extinguishment of debt of $213, before tax, in 2013 related to the repurchase of approximately $800 of senior notes at a premium to the face
amount of the then outstanding debt. The resulting loss on extinguishment of debt consists of the repurchase premium, the write-off of the unamortized
discount and debt issuance and other costs related to the repurchase transaction.
• Pension settlement charge of $128, before tax, in 2014, in insurance operating costs and other expenses, related to voluntary lump-sum settlements with
vested participants in the Company's defined benefit pension plan who had separated from service, but who had not yet commenced annuity benefits.
For additional information, see MD&A - Capital Resources and Liquidity, Pension Plans and Other Postretirement Benefits.
35