The Hartford 2014 Annual Report Download - page 83
Download and view the complete annual report
Please find page 83 of the 2014 The Hartford annual report below. You can navigate through the pages in the report by either clicking on the pages listed below, or by using the keyword search tool below to find specific information within the annual report.-
 1
1 -
2
-
3
-
4
-
5
-
6
-
7
-
8
-
9
-
10
-
11
-
12
-
13
-
14
-
15
-
16
-
17
-
18
-
19
-
20
-
21
-
22
-
23
-
24
-
25
-
26
-
27
-
28
-
29
-
30
-
31
-
32
-
33
-
34
-
35
-
36
-
37
-
38
-
39
-
40
-
41
-
42
-
43
-
44
-
45
-
46
-
47
-
48
-
49
-
50
-
51
-
52
-
53
-
54
-
55
-
56
-
57
-
58
-
59
-
60
-
61
-
62
-
63
-
64
-
65
-
66
-
67
-
68
-
69
-
70
-
71
-
72
-
 73
73 -
 74
74 -
 75
75 -
 76
76 -
 77
77 -
 78
78 -
 79
79 -
 80
80 -
 81
81 -
 82
82 -
 83
83 -
 84
84 -
 85
85 -
 86
86 -
 87
87 -
 88
88 -
 89
89 -
 90
90 -
 91
91 -
 92
92 -
 93
93 -
94
-
95
-
96
-
97
-
98
-
99
-
100
-
101
-
102
-
103
-
104
-
105
-
106
-
107
-
108
-
109
-
110
-
111
-
112
-
113
-
114
-
115
-
116
-
117
-
118
-
119
-
120
-
121
-
122
-
123
-
124
-
125
-
126
-
127
-
128
-
129
-
130
-
131
-
132
-
133
-
134
-
135
-
136
-
137
-
138
-
139
-
140
-
141
-
142
-
143
-
144
-
145
-
146
-
147
-
148
-
149
-
150
-
151
-
152
-
153
-
154
-
155
-
156
-
157
-
158
-
159
-
160
-
161
-
162
-
163
-
164
-
165
-
166
-
167
-
168
-
169
-
170
-
171
-
172
-
173
-
174
-
175
-
176
-
177
-
178
-
179
-
180
-
181
-
182
-
183
-
184
-
185
-
186
-
187
-
188
-
189
-
190
-
191
-
192
-
193
-
194
-
195
-
196
-
197
-
198
-
199
-
200
-
201
-
202
-
203
-
204
-
205
-
206
-
207
-
208
-
209
-
210
-
211
-
212
-
213
-
214
-
215
-
216
-
217
-
218
-
219
-
220
-
221
-
222
-
223
-
224
-
225
-
226
-
227
-
228
-
229
-
230
-
231
-
232
-
233
-
234
-
235
-
236
-
237
-
238
-
239
-
240
-
241
-
242
-
243
-
244
-
245
-
246
-
247
-
248
-
249
-
250
-
251
-
252
-
253
-
254
-
255
-
256
-
257
-
258
-
259
-
260
-
261
-
262
-
263
-
264
-
265
-
266
-
267
-
268
-
269
-
270
-
271
-
272
-
273
-
274
-
275
-
276
-
277
-
278
-
279
-
280
-
281
-
282
-
283
-
284
-
285
-
286
-
287
-
288
-
289
-
290
-
291
-
292
-
293
-
294
-
295
-
296
 |
 |

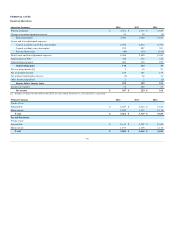
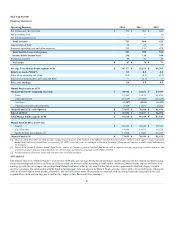
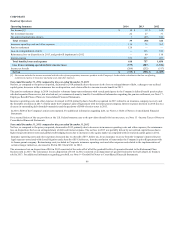
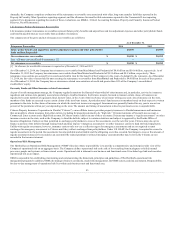
Results of Operations
Earned premiums [1] $ 206 $ 94 $ (4)
Fee income and other [1] 1,201 1,369 2,712
Net investment income 1,542 1,577 2,462
Net realized capital gains 26 1,719 236
Benefits, losses and loss adjustment expenses 1,643 1,717 2,896
Amortization of DAC 402 485 663
Insurance operating costs and other expenses 567 645 1,277
Reinsurance (gain) loss on disposition in 2014 and 2013, respectively, goodwill impairment of
$224 in 2012 and premium deficiency of $191 in 2012 (23) 1,505 415
Income tax expense (benefit) 16 (7) (99)
Loss from discontinued operations, net of tax [2] (1,048) (253)
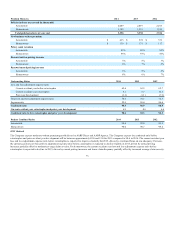
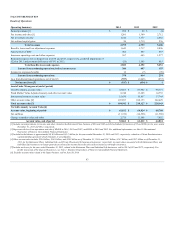
Variable annuity account value $ 52,861 $ 81,942 $ 94,371
Fixed Market Value Adjusted annuity and other account value 8,748 13,203 14,755
Institutional annuity account value 15,636 16,857 17,744
Other account value [4] 107,697 108,133 102,429
Net outflows (11,726) (14,598) (11,388)
Change in market value and other 2,775 11,586 7,452
[1]Includes earned premiums, fee income and other related to the Retirement Plans business of $38 and $368 and the Individual Life business of $2 and $866, for the years ended
December 31, 2013 and 2012, respectively.
[2]Represents the loss from operations and sale of HLIKK in 2014, 2013 and 2012, and HLIL in 2013 and 2012. For additional information, see Note 19 Discontinued
Operations of Notes to Consolidated Financial Statements.
[3]Included in the balance is approximately $(1.0) billion and $(1.2) billion for the years ended December 31, 2013 and 2012, respectively, related to a Talcott Resolution intra-
segment funding agreement which eliminates in consolidation.
[4]Other account value includes $53.0 billion, $14.9 billion, and $39.8 billion as of December 31, 2014, and $54.7 billion, $14.7 billion, and $38.7 billion as of December 31,
2013, for the Retirement Plans, Individual Life, and Private Placement Life Insurance businesses; respectively. Account values associated with the Retirement Plans, and
Individual Life businesses no longer generate asset-based fee income due to the sales of these businesses through reinsurance.
[5]Includes net losses for the year ended December 31, 2012, related to the Retirement Plans and Individual Life businesses sold in 2013 of $39 and $172, respectively. For
further discussion of the disposed businesses, see Note 2 - Business Dispositions of Notes to Consolidated Financial Statements.
[6] Excludes account value related to the Japan business sold on June 30, 2014.
83