The Hartford 2014 Annual Report Download - page 96
Download and view the complete annual report
Please find page 96 of the 2014 The Hartford annual report below. You can navigate through the pages in the report by either clicking on the pages listed below, or by using the keyword search tool below to find specific information within the annual report.-
 1
1 -
2
-
3
-
4
-
5
-
6
-
7
-
8
-
9
-
10
-
11
-
12
-
13
-
14
-
15
-
16
-
17
-
18
-
19
-
20
-
21
-
22
-
23
-
24
-
25
-
26
-
27
-
28
-
29
-
30
-
31
-
32
-
33
-
34
-
35
-
36
-
37
-
38
-
39
-
40
-
41
-
42
-
43
-
44
-
45
-
46
-
47
-
48
-
49
-
50
-
51
-
52
-
53
-
54
-
55
-
56
-
57
-
58
-
59
-
60
-
61
-
62
-
63
-
64
-
65
-
66
-
67
-
68
-
69
-
70
-
71
-
72
-
73
-
74
-
75
-
76
-
77
-
78
-
79
-
80
-
81
-
82
-
83
-
84
-
85
-
 86
86 -
 87
87 -
 88
88 -
 89
89 -
 90
90 -
 91
91 -
 92
92 -
 93
93 -
 94
94 -
 95
95 -
 96
96 -
 97
97 -
 98
98 -
 99
99 -
 100
100 -
 101
101 -
 102
102 -
 103
103 -
 104
104 -
 105
105 -
 106
106 -
107
-
108
-
109
-
110
-
111
-
112
-
113
-
114
-
115
-
116
-
117
-
118
-
119
-
120
-
121
-
122
-
123
-
124
-
125
-
126
-
127
-
128
-
129
-
130
-
131
-
132
-
133
-
134
-
135
-
136
-
137
-
138
-
139
-
140
-
141
-
142
-
143
-
144
-
145
-
146
-
147
-
148
-
149
-
150
-
151
-
152
-
153
-
154
-
155
-
156
-
157
-
158
-
159
-
160
-
161
-
162
-
163
-
164
-
165
-
166
-
167
-
168
-
169
-
170
-
171
-
172
-
173
-
174
-
175
-
176
-
177
-
178
-
179
-
180
-
181
-
182
-
183
-
184
-
185
-
186
-
187
-
188
-
189
-
190
-
191
-
192
-
193
-
194
-
195
-
196
-
197
-
198
-
199
-
200
-
201
-
202
-
203
-
204
-
205
-
206
-
207
-
208
-
209
-
210
-
211
-
212
-
213
-
214
-
215
-
216
-
217
-
218
-
219
-
220
-
221
-
222
-
223
-
224
-
225
-
226
-
227
-
228
-
229
-
230
-
231
-
232
-
233
-
234
-
235
-
236
-
237
-
238
-
239
-
240
-
241
-
242
-
243
-
244
-
245
-
246
-
247
-
248
-
249
-
250
-
251
-
252
-
253
-
254
-
255
-
256
-
257
-
258
-
259
-
260
-
261
-
262
-
263
-
264
-
265
-
266
-
267
-
268
-
269
-
270
-
271
-
272
-
273
-
274
-
275
-
276
-
277
-
278
-
279
-
280
-
281
-
282
-
283
-
284
-
285
-
286
-
287
-
288
-
289
-
290
-
291
-
292
-
293
-
294
-
295
-
296
 |
 |

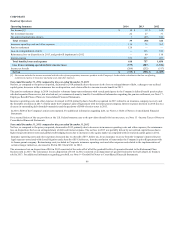
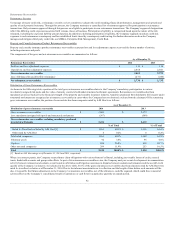
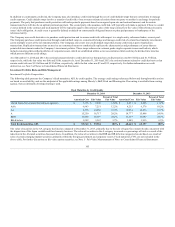
Fixed Maturity Investments
The Company’s investment portfolios primarily consist of investment grade fixed maturity securities. The fair value of fixed maturity investments was $59.9
billion and $63.2 billion at December 31, 2014 and 2013, respectively. The fair value of these and other invested assets fluctuates depending on the interest
rate environment and other general economic conditions. The weighted average duration of the portfolio, including fixed maturities, commercial mortgage
loans, certain derivatives, and cash equivalents, was approximately 5.3 years as of both December 31, 2014 and 2013. As of December 31, 2013, the weighted
average duration of the portfolio, excluding the Japan variable and fixed annuity business, was approximately 5.2 years.
Liabilities
The Company’s issued investment contracts and certain insurance product liabilities, other than non-guaranteed separate accounts, include asset
accumulation vehicles such as fixed annuities, guaranteed investment contracts, other investment and universal life-type contracts and certain insurance
products such as long-term disability.
Asset accumulation vehicles primarily require a fixed rate payment, often for a specified period of time, such as fixed rate annuities with a market value
adjustment feature. The term to maturity of these contracts generally range from less than one year to ten years. In addition, certain products such as corporate
owned life insurance contracts and the general account portion of Talcott Resolutions’ variable annuity products, credit interest to policyholders subject to
market conditions and minimum interest rate guarantees. The term to maturity of the asset portfolio supporting these products may range from short to
intermediate.
While interest rate risk associated with many of these products has been reduced through the use of market value adjustment features and surrender charges,
the primary risk associated with these products is that the spread between investment return and credited rate may not be sufficient to earn targeted returns.
The Company also manages the risk of certain insurance liabilities similarly to investment type products due to the relative predictability of the aggregate
cash flow payment streams. Products in this category may contain significant reliance upon actuarial (including mortality and morbidity) pricing
assumptions and do have some element of cash flow uncertainty. Product examples include structured settlement contracts, on-benefit annuities (i.e., the
annuitant is currently receiving benefits thereon) and short-term and long-term disability contracts. The cash outflows associated with these policy liabilities
are not interest rate sensitive but do vary based on the timing and amount of benefit payments. The primary risks associated with these products are that the
benefits will exceed expected actuarial pricing and/or that the actual timing of the cash flows will differ from those anticipated, or interest rate levels may
deviate from those assumed in product pricing, ultimately resulting in an investment return lower than that assumed in pricing. The average duration of the
liability cash flow payments can range from less than one year to in excess of fifteen years.
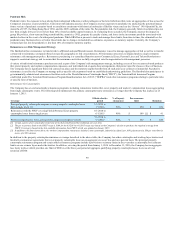
Derivatives
The Company utilizes a variety of derivative instruments to mitigate interest rate risk associated with its investment portfolio or hedge liabilities. Interest rate
swaps are primarily used to convert interest receipts or payments to a fixed or variable rate. The use of such swaps enable the Company to customize contract
terms and conditions to desired objectives and manage the duration profile within established tolerances. Interest rate swaps are also used to hedge the
variability in the cash flow of a forecasted purchase or sale of fixed rate securities due to changes in interest rates. Interest rate caps, floors, swaps, swaptions,
and futures may be used to manage portfolio duration.
As of December 31, 2014 and 2013 notional amounts pertaining to derivatives utilized to manage interest rate risk, including offsetting positions, totaled
$19.3 billion and $15.3 billion, respectively ($19.2 billion and $15.1 billion, respectively, related to investments and $0.1 billion and $0.2 billion,
respectively, related to Talcott Resolution liabilities). The fair value of these derivatives was $(468) and $(603) as of December 31, 2014 and 2013,
respectively. These amounts do not include derivatives associated with the Variable Annuity Hedging Program.
96