The Hartford 2014 Annual Report Download - page 179
Download and view the complete annual report
Please find page 179 of the 2014 The Hartford annual report below. You can navigate through the pages in the report by either clicking on the pages listed below, or by using the keyword search tool below to find specific information within the annual report.-
 1
1 -
2
-
3
-
4
-
5
-
6
-
7
-
8
-
9
-
10
-
11
-
12
-
13
-
14
-
15
-
16
-
17
-
18
-
19
-
20
-
21
-
22
-
23
-
24
-
25
-
26
-
27
-
28
-
29
-
30
-
31
-
32
-
33
-
34
-
35
-
36
-
37
-
38
-
39
-
40
-
41
-
42
-
43
-
44
-
45
-
46
-
47
-
48
-
49
-
50
-
51
-
52
-
53
-
54
-
55
-
56
-
57
-
58
-
59
-
60
-
61
-
62
-
63
-
64
-
65
-
66
-
67
-
68
-
69
-
70
-
71
-
72
-
73
-
74
-
75
-
76
-
77
-
78
-
79
-
80
-
81
-
82
-
83
-
84
-
85
-
86
-
87
-
88
-
89
-
90
-
91
-
92
-
93
-
94
-
95
-
96
-
97
-
98
-
99
-
100
-
101
-
102
-
103
-
104
-
105
-
106
-
107
-
108
-
109
-
110
-
111
-
112
-
113
-
114
-
115
-
116
-
117
-
118
-
119
-
120
-
121
-
122
-
123
-
124
-
125
-
126
-
127
-
128
-
129
-
130
-
131
-
132
-
133
-
134
-
135
-
136
-
137
-
138
-
139
-
140
-
141
-
142
-
143
-
144
-
145
-
146
-
147
-
148
-
149
-
150
-
151
-
152
-
153
-
154
-
155
-
156
-
157
-
158
-
159
-
160
-
161
-
162
-
163
-
164
-
165
-
166
-
167
-
168
-
 169
169 -
 170
170 -
 171
171 -
 172
172 -
 173
173 -
 174
174 -
 175
175 -
 176
176 -
 177
177 -
 178
178 -
 179
179 -
 180
180 -
 181
181 -
 182
182 -
 183
183 -
 184
184 -
 185
185 -
 186
186 -
 187
187 -
 188
188 -
 189
189 -
190
-
191
-
192
-
193
-
194
-
195
-
196
-
197
-
198
-
199
-
200
-
201
-
202
-
203
-
204
-
205
-
206
-
207
-
208
-
209
-
210
-
211
-
212
-
213
-
214
-
215
-
216
-
217
-
218
-
219
-
220
-
221
-
222
-
223
-
224
-
225
-
226
-
227
-
228
-
229
-
230
-
231
-
232
-
233
-
234
-
235
-
236
-
237
-
238
-
239
-
240
-
241
-
242
-
243
-
244
-
245
-
246
-
247
-
248
-
249
-
250
-
251
-
252
-
253
-
254
-
255
-
256
-
257
-
258
-
259
-
260
-
261
-
262
-
263
-
264
-
265
-
266
-
267
-
268
-
269
-
270
-
271
-
272
-
273
-
274
-
275
-
276
-
277
-
278
-
279
-
280
-
281
-
282
-
283
-
284
-
285
-
286
-
287
-
288
-
289
-
290
-
291
-
292
-
293
-
294
-
295
-
296
 |
 |
Table of Contents
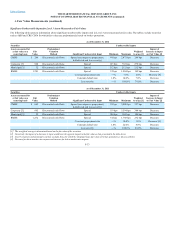
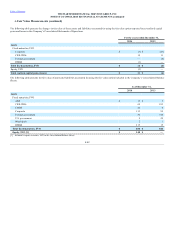
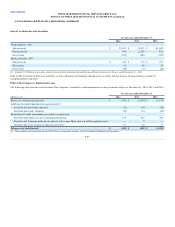
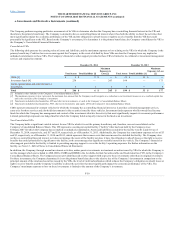
Financial Instruments Not Carried at Fair Value
The following table presents carrying amounts and fair values of The Hartford’s financial instruments not carried at fair value and not included in the above
fair value discussion as of December 31, 2014 and 2013.
Policy loans Level 3 $ 1,431 $ 1,431 $ 1,420 $ 1,480
Mortgage loans Level 3 5,556 5,840 5,598 5,641
Other policyholder funds and benefits payable [1] Level 3 $ 7,304 $ 7,522 $ 9,152 $ 9,352
Senior notes [2] Level 2 5,009 5,837 5,206 5,845
Junior subordinated debentures [2] Level 2 1,100 1,291 1,100 1,271
Revolving credit facility Level 2 — — 238 238
Consumer notes [3] [4] Level 3 68 68 82 82
Assumed investment contracts [4] Level 3 763 851 — —
[1] Excludes guarantees on variable annuities, group accident and health and universal life insurance contracts, including corporate owned life insurance.
[2] Included in long-term debt in the Consolidated Balance Sheets, except for current maturities, which are included in short-term debt.
[3] Excludes amounts carried at fair value and included in preceding disclosures.
[4] Included in other liabilities in the Consolidated Balance Sheets.
Fair values for policy loans were determined using current loan coupon rates, which reflect the current rates available under the contracts. As a result, the
carrying value approximates the fair value of the policy loans. During the second quarter of 2014, the Company changed the valuation technique used to
estimate the fair value of policy loans, which previously was estimated by utilizing discounted cash flow calculations, using U.S. Treasury interest rates,
based on the loan durations.
Fair values for mortgage loans were estimated using discounted cash flow calculations based on current lending rates for similar type loans. Current lending
rates reflect changes in credit spreads and the remaining terms of the loans.
Fair values for other policyholder funds and benefits payable, and assumed investment contracts, not carried at fair value, are estimated based on the cash
surrender values of the underlying policies or by estimating future cash flows discounted at current interest rates adjusted for credit risk.
Fair values for senior notes and junior subordinated debentures are determined using the market approach based on reported trades, benchmark interest rates
and issuer spread for the Company which may consider credit default swaps.
Fair values for consumer notes were estimated using discounted cash flow calculations using current interest rates adjusted for estimated loan durations.
F-43