The Hartford 2014 Annual Report Download - page 183
Download and view the complete annual report
Please find page 183 of the 2014 The Hartford annual report below. You can navigate through the pages in the report by either clicking on the pages listed below, or by using the keyword search tool below to find specific information within the annual report.-
 1
1 -
2
-
3
-
4
-
5
-
6
-
7
-
8
-
9
-
10
-
11
-
12
-
13
-
14
-
15
-
16
-
17
-
18
-
19
-
20
-
21
-
22
-
23
-
24
-
25
-
26
-
27
-
28
-
29
-
30
-
31
-
32
-
33
-
34
-
35
-
36
-
37
-
38
-
39
-
40
-
41
-
42
-
43
-
44
-
45
-
46
-
47
-
48
-
49
-
50
-
51
-
52
-
53
-
54
-
55
-
56
-
57
-
58
-
59
-
60
-
61
-
62
-
63
-
64
-
65
-
66
-
67
-
68
-
69
-
70
-
71
-
72
-
73
-
74
-
75
-
76
-
77
-
78
-
79
-
80
-
81
-
82
-
83
-
84
-
85
-
86
-
87
-
88
-
89
-
90
-
91
-
92
-
93
-
94
-
95
-
96
-
97
-
98
-
99
-
100
-
101
-
102
-
103
-
104
-
105
-
106
-
107
-
108
-
109
-
110
-
111
-
112
-
113
-
114
-
115
-
116
-
117
-
118
-
119
-
120
-
121
-
122
-
123
-
124
-
125
-
126
-
127
-
128
-
129
-
130
-
131
-
132
-
133
-
134
-
135
-
136
-
137
-
138
-
139
-
140
-
141
-
142
-
143
-
144
-
145
-
146
-
147
-
148
-
149
-
150
-
151
-
152
-
153
-
154
-
155
-
156
-
157
-
158
-
159
-
160
-
161
-
162
-
163
-
164
-
165
-
166
-
167
-
168
-
169
-
170
-
171
-
172
-
 173
173 -
 174
174 -
 175
175 -
 176
176 -
 177
177 -
 178
178 -
 179
179 -
 180
180 -
 181
181 -
 182
182 -
 183
183 -
 184
184 -
 185
185 -
 186
186 -
 187
187 -
 188
188 -
 189
189 -
 190
190 -
 191
191 -
 192
192 -
 193
193 -
194
-
195
-
196
-
197
-
198
-
199
-
200
-
201
-
202
-
203
-
204
-
205
-
206
-
207
-
208
-
209
-
210
-
211
-
212
-
213
-
214
-
215
-
216
-
217
-
218
-
219
-
220
-
221
-
222
-
223
-
224
-
225
-
226
-
227
-
228
-
229
-
230
-
231
-
232
-
233
-
234
-
235
-
236
-
237
-
238
-
239
-
240
-
241
-
242
-
243
-
244
-
245
-
246
-
247
-
248
-
249
-
250
-
251
-
252
-
253
-
254
-
255
-
256
-
257
-
258
-
259
-
260
-
261
-
262
-
263
-
264
-
265
-
266
-
267
-
268
-
269
-
270
-
271
-
272
-
273
-
274
-
275
-
276
-
277
-
278
-
279
-
280
-
281
-
282
-
283
-
284
-
285
-
286
-
287
-
288
-
289
-
290
-
291
-
292
-
293
-
294
-
295
-
296
 |
 |
Table of Contents
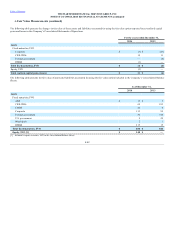
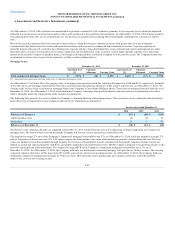
The Company did not have exposure to any credit concentration risk of a single issuer greater than 10% of the Company's stockholders' equity, other than the
U.S. government and certain U.S. government securities as of December 31, 2014. As of December 31, 2013, the Company's only exposure to any credit
concentration risk of a single issuer greater than 10% of the Company's stockholders' equity, other than the U.S. government and certain U.S. government
securities, was the Government of Japan, which represents $2.6 billion, or 14% of stockholders' equity, and 3% of total invested assets. As of December 31,
2014, other than U.S. government and certain U.S. government agencies, the Company’s three largest exposures by issuer were the State of Illinois, JP
Morgan Chase &Co., and Goldman Sachs Group Inc. which each comprised less than 1% of total invested assets. As of December 31, 2013, other than U.S.
government and certain U.S. government agencies, the Company’s three largest exposures by issuer were the Government of Japan, Goldman Sachs Group
Inc., and State of Illinois which each comprised less than 4% of total invested assets. The Company’s three largest exposures by sector as of December 31,
2014 were municipal securities, financial services, and utilities which comprised approximately 17%, 7% and 6%, respectively, of total invested assets. The
Company’s three largest exposures by sector as of December 31, 2013 were municipal investments, utilities, and financial services which comprised
approximately 15%, 8% and 7%, respectively, of total invested assets.
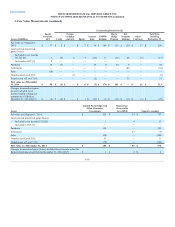
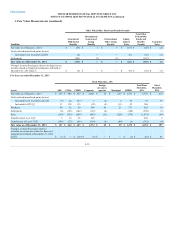
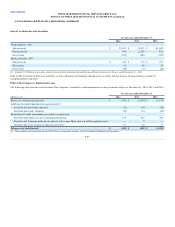
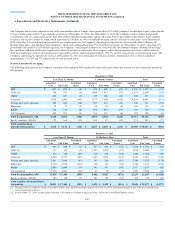
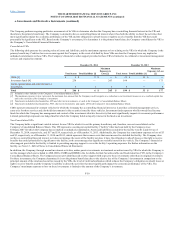
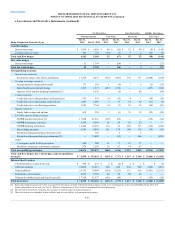
The following tables present the Company’s unrealized loss aging for AFS securities by type and length of time the security was in a continuous unrealized
loss position.
ABS $ 897 $ 893 $ (4)
$ 473 $ 440 $ (33)
$ 1,370 $ 1,333 $ (37)
CDOs [1] 748 743 (5)
1,489 1,461 (31)
2,237 2,204 (36)
CMBS 230 227 (3)
319 306 (13)
549 533 (16)
Corporate 3,082 2,980 (102)
1,177 1,068 (109)
4,259 4,048 (211)
Foreign govt./govt. agencies 363 349 (14)
227 212 (15)
590 561 (29)
Municipal 74 73 (1)
86 82 (4)
160 155 (5)
RMBS 320 318 (2)
433 416 (17)
753 734 (19)
U.S. Treasuries 432 431 (1)
361 357 (4)
793 788 (5)
Equity securities, AFS [2] 172 160 (12)
102 87 (15)
274 247 (27)
ABS $ 893 $ 888 $ (5)
$ 477 $ 418 $ (59)
$ 1,370 $ 1,306 $ (64)
CDOs [1] 137 135 (2)
1,933 1,874 (57)
2,070 2,009 (59)
CMBS 812 788 (24)
610 576 (34)
1,422 1,364 (58)
Corporate 4,922 4,737 (185)
1,225 1,064 (161)
6,147 5,801 (346)
Foreign govt./govt. agencies 2,961 2,868 (93)
343 260 (83)
3,304 3,128 (176)
Municipal 3,150 2,994 (156)
190 162 (28)
3,340 3,156 (184)
RMBS 2,046 2,008 (38)
591 547 (44)
2,637 2,555 (82)
U.S. Treasuries 2,914 2,862 (52)
33 26 (7)
2,947 2,888 (59)
Equity securities, AFS [2] 196 188 (8)
223 182 (41)
419 370 (49)
[1] Unrealized losses exclude the change in fair value of bifurcated embedded derivative features of certain securities. Subsequent changes in fair value are recorded in net
realized capital gains (losses).
[2] As of December 31, 2014, excludes equity securities, FVO which are included in equity securities, AFS on the Consolidated Balance Sheets.
F-47