The Hartford 2014 Annual Report Download - page 235
Download and view the complete annual report
Please find page 235 of the 2014 The Hartford annual report below. You can navigate through the pages in the report by either clicking on the pages listed below, or by using the keyword search tool below to find specific information within the annual report.-
 1
1 -
2
-
3
-
4
-
5
-
6
-
7
-
8
-
9
-
10
-
11
-
12
-
13
-
14
-
15
-
16
-
17
-
18
-
19
-
20
-
21
-
22
-
23
-
24
-
25
-
26
-
27
-
28
-
29
-
30
-
31
-
32
-
33
-
34
-
35
-
36
-
37
-
38
-
39
-
40
-
41
-
42
-
43
-
44
-
45
-
46
-
47
-
48
-
49
-
50
-
51
-
52
-
53
-
54
-
55
-
56
-
57
-
58
-
59
-
60
-
61
-
62
-
63
-
64
-
65
-
66
-
67
-
68
-
69
-
70
-
71
-
72
-
73
-
74
-
75
-
76
-
77
-
78
-
79
-
80
-
81
-
82
-
83
-
84
-
85
-
86
-
87
-
88
-
89
-
90
-
91
-
92
-
93
-
94
-
95
-
96
-
97
-
98
-
99
-
100
-
101
-
102
-
103
-
104
-
105
-
106
-
107
-
108
-
109
-
110
-
111
-
112
-
113
-
114
-
115
-
116
-
117
-
118
-
119
-
120
-
121
-
122
-
123
-
124
-
125
-
126
-
127
-
128
-
129
-
130
-
131
-
132
-
133
-
134
-
135
-
136
-
137
-
138
-
139
-
140
-
141
-
142
-
143
-
144
-
145
-
146
-
147
-
148
-
149
-
150
-
151
-
152
-
153
-
154
-
155
-
156
-
157
-
158
-
159
-
160
-
161
-
162
-
163
-
164
-
165
-
166
-
167
-
168
-
169
-
170
-
171
-
172
-
173
-
174
-
175
-
176
-
177
-
178
-
179
-
180
-
181
-
182
-
183
-
184
-
185
-
186
-
187
-
188
-
189
-
190
-
191
-
192
-
193
-
194
-
195
-
196
-
197
-
198
-
199
-
200
-
201
-
202
-
203
-
204
-
205
-
206
-
207
-
208
-
209
-
210
-
211
-
212
-
213
-
214
-
215
-
216
-
217
-
218
-
219
-
220
-
221
-
222
-
223
-
224
-
 225
225 -
 226
226 -
 227
227 -
 228
228 -
 229
229 -
 230
230 -
 231
231 -
 232
232 -
 233
233 -
 234
234 -
 235
235 -
 236
236 -
 237
237 -
 238
238 -
 239
239 -
 240
240 -
 241
241 -
 242
242 -
 243
243 -
 244
244 -
 245
245 -
246
-
247
-
248
-
249
-
250
-
251
-
252
-
253
-
254
-
255
-
256
-
257
-
258
-
259
-
260
-
261
-
262
-
263
-
264
-
265
-
266
-
267
-
268
-
269
-
270
-
271
-
272
-
273
-
274
-
275
-
276
-
277
-
278
-
279
-
280
-
281
-
282
-
283
-
284
-
285
-
286
-
287
-
288
-
289
-
290
-
291
-
292
-
293
-
294
-
295
-
296
 |
 |
Table of Contents
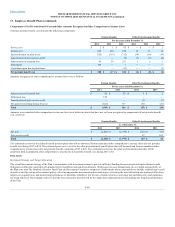
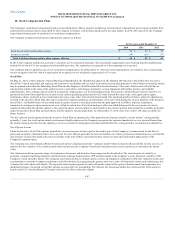
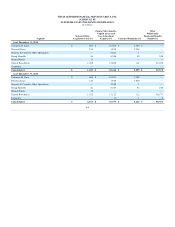
Other performance share awards or portions thereof have a market condition based upon the Company's total shareholder return relative to a group of peer
companies within a three year period. Stock compensation expense for these performance share awards is based on the number of awards expected to vest as
estimated at the grant date and therefore does not change for changes in estimated performance. The Company uses a risk neutral Monte-Carlo valuation
model that incorporates time to maturity, implied volatilities of the Company and the peer companies, and correlations between the Company and the peer
companies and interest rates. The range for assumptions of inputs are disclosed below.
Volatility of common stock 31.6% 42.8% 70.0%
Average volatility of peer companies 17.0% - 29.0% 20.0% - 36.0% 26.0% - 75.0%
Average correlation coefficient of peer companies 62.0% 76.0% 78.0%
Risk-free spot rate 0.7% 0.4% 0.4%
Term 3.0 years 3.0 years 3.0 years
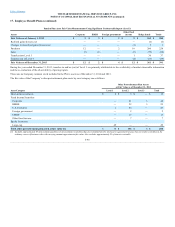
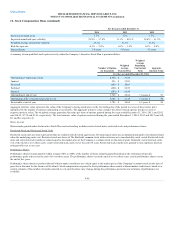
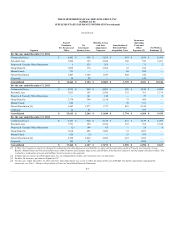
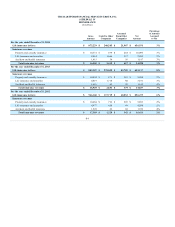
Total Share Awards
A summary of non-vested share award activity under the Company's Incentive Stock Plan is presented below.
Non-vested at beginning of year 7,172 $ 24.26 1,371 $ 24.95
Granted 1,824 $ 35.74 334 $ 36.45
Performance based adjustment — $ — 347 $ 20.63
Vested (1,071) $ 27.73 (880) $ 20.63
Forfeited (693) $ 24.69 (109) $ 26.79
Non-vested at end of year 7,232 $ 26.59 1,063 $ 30.55
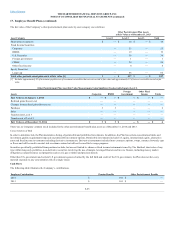
The weighted average grant-date fair value per share of restricted stock units and restricted stock granted during the years ended December 31, 2014, 2013,
and 2012 was $35.74, $27.72 and $21.97, respectively. The weighted average grant-date fair value per share of performance shares granted during the years
ended December 31, 2014, 2013, and 2012 was $36.45, $27.92 and $20.63, respectively.
The total fair value of shares vested during the years ended December 31, 2014, 2013 and 2012 was $75, $42 and $20, respectively, based on actual or
estimated performance factors. The Company did not make cash payments in settlement of stock compensation during the years ended December 31, 2014,
2013 and 2012.
In 2013 the Company established a subsidiary stock-based compensation plan similar to The Hartford Incentive Stock Plan except that it awards non-public
subsidiary stock as compensation. The Company recognized stock-based compensation plans expense of $4 and $1 in the years ended December 31, 2014
and 2013 for the subsidiary stock plan. Upon employee vesting of subsidiary stock, the Company will recognize a noncontrolling equity interest. Employees
will be restricted from selling vested subsidiary stock to other than the Company and the Company will have discretion on the amount of stock to repurchase.
Therefore the subsidiary stock will be classified as equity because it is not mandatorily redeemable.
F-99