The Hartford 2014 Annual Report Download - page 36
Download and view the complete annual report
Please find page 36 of the 2014 The Hartford annual report below. You can navigate through the pages in the report by either clicking on the pages listed below, or by using the keyword search tool below to find specific information within the annual report.-
 1
1 -
2
-
3
-
4
-
5
-
6
-
7
-
8
-
9
-
10
-
11
-
12
-
13
-
14
-
15
-
16
-
17
-
18
-
19
-
20
-
21
-
22
-
23
-
24
-
25
-
 26
26 -
 27
27 -
 28
28 -
 29
29 -
 30
30 -
 31
31 -
 32
32 -
 33
33 -
 34
34 -
 35
35 -
 36
36 -
 37
37 -
 38
38 -
 39
39 -
 40
40 -
 41
41 -
 42
42 -
 43
43 -
 44
44 -
 45
45 -
 46
46 -
47
-
48
-
49
-
50
-
51
-
52
-
53
-
54
-
55
-
56
-
57
-
58
-
59
-
60
-
61
-
62
-
63
-
64
-
65
-
66
-
67
-
68
-
69
-
70
-
71
-
72
-
73
-
74
-
75
-
76
-
77
-
78
-
79
-
80
-
81
-
82
-
83
-
84
-
85
-
86
-
87
-
88
-
89
-
90
-
91
-
92
-
93
-
94
-
95
-
96
-
97
-
98
-
99
-
100
-
101
-
102
-
103
-
104
-
105
-
106
-
107
-
108
-
109
-
110
-
111
-
112
-
113
-
114
-
115
-
116
-
117
-
118
-
119
-
120
-
121
-
122
-
123
-
124
-
125
-
126
-
127
-
128
-
129
-
130
-
131
-
132
-
133
-
134
-
135
-
136
-
137
-
138
-
139
-
140
-
141
-
142
-
143
-
144
-
145
-
146
-
147
-
148
-
149
-
150
-
151
-
152
-
153
-
154
-
155
-
156
-
157
-
158
-
159
-
160
-
161
-
162
-
163
-
164
-
165
-
166
-
167
-
168
-
169
-
170
-
171
-
172
-
173
-
174
-
175
-
176
-
177
-
178
-
179
-
180
-
181
-
182
-
183
-
184
-
185
-
186
-
187
-
188
-
189
-
190
-
191
-
192
-
193
-
194
-
195
-
196
-
197
-
198
-
199
-
200
-
201
-
202
-
203
-
204
-
205
-
206
-
207
-
208
-
209
-
210
-
211
-
212
-
213
-
214
-
215
-
216
-
217
-
218
-
219
-
220
-
221
-
222
-
223
-
224
-
225
-
226
-
227
-
228
-
229
-
230
-
231
-
232
-
233
-
234
-
235
-
236
-
237
-
238
-
239
-
240
-
241
-
242
-
243
-
244
-
245
-
246
-
247
-
248
-
249
-
250
-
251
-
252
-
253
-
254
-
255
-
256
-
257
-
258
-
259
-
260
-
261
-
262
-
263
-
264
-
265
-
266
-
267
-
268
-
269
-
270
-
271
-
272
-
273
-
274
-
275
-
276
-
277
-
278
-
279
-
280
-
281
-
282
-
283
-
284
-
285
-
286
-
287
-
288
-
289
-
290
-
291
-
292
-
293
-
294
-
295
-
296
 |
 |

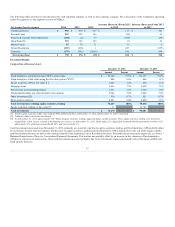
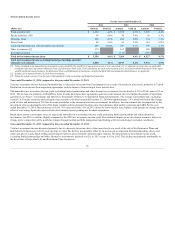
• Net investment income of $3,154, before tax, in 2014 decreased from $3,264, before tax, in 2013. The decrease in net investment income is primarily
due to lower income from fixed maturities, as a result of a decline in asset levels, primarily in Talcott Resolution, lower income from repurchase
agreements, and the impact of reinvesting at lower interest rates. For further discussion of investment results, see MD&A - Investment Results, Net
Investment Income (Loss).
• Current accident year catastrophe losses in Property & Casualty of $341, before tax, in 2014, compared to $312, before tax, in 2013. The increase in
current accident year catastrophe losses was primarily due to increased frequency and severity from wind and hail events across various U.S. geographic
regions. For additional information, see MD&A - Critical Accounting Estimates, Property and Casualty Insurance Product Reserves, Net of Reinsurance.
• Prior accident year reserve strengthening in Property & Casualty of $228, before tax, in 2014, compared to reserve strengthening of $192, before tax, in
2013. Reserve strengthenings in 2014 were primarily related to an increase in reserves for asbestos and environmental claims, primarily due to a higher
than previously estimated number of mesothelioma claim filings and an increase in costs associated with asbestos litigation. Reserve strengthenings in
2013 were primarily related to increased net asbestos reserves due to higher claim frequency and severity as well as costs and expenses associated with
litigating asbestos coverage matters.
• Differences between the Company's effective income tax rate and the U.S. statutory rate of 35% are due primarily to tax-exempt interest earned on
invested assets and the dividends received deduction ("DRD"). The $104 increase in income tax expense in 2014 compared with 2013 was primarily
due to the $228 increase in income from continuing operations, before tax. Income tax expense of $350 and $246 in 2014 and 2013, respectively,
includes separate account DRD benefits of $114 and $139, respectively.
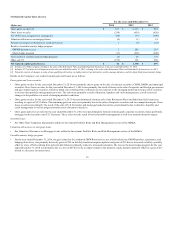
Year ended December 31, 2013 compared to the year ended December 31, 2012
The increase in net income from 2012 to 2013 was primarily due to the net effect of the following items:
• An increase in the loss from discontinued operations to $1,049, net of tax, compared to $258, net of tax, in 2013. The loss from discontinued operations
in 2013 includes the results of operations of the Japan and U.K. annuity businesses and the realized capital loss on the sale of HLIL. The loss from
discontinued operations in 2012 includes the results of operations of the Japan and U.K. annuity businesses.
• Reinsurance loss on disposition of $533, before tax, in 2012 consisting of an impairment of goodwill and a loss accrual for premium deficiency related
to the disposition of the Individual Life business, and losses in 2012 from the operations of the Retirement Plans and Individual Life businesses sold in
2013.
• A loss on extinguishment of debt of $213, before tax, in 2013, compared to $910, before tax in 2012. The loss in 2013 related to the repurchase of
approximately $800 of senior notes and the loss in 2012 related to the repurchase of all outstanding 10% fixed-to-floating rate junior subordinated
debentures due 2068 with a $1.75 billion aggregate principal amount all held by Allianz.
• Current accident year catastrophe losses in Property & Casualty of $312, before tax, in 2013, compared to $706, before tax, in 2012. Losses in 2013
were primarily due to multiple thunderstorm, hail, and tornado events across various U.S. geographic regions. Losses in 2012 were primarily driven by
$350 related to Storm Sandy and multiple thunderstorm, hail, and tornado events across various U.S. geographic regions.
• Current accident year losses and loss adjustment expenses before catastrophes in Property & Casualty of $6.3 billion, before tax, in 2013 decreased from
$6.6 billion, before tax, in 2012. The decrease was primarily driven by lower loss and loss adjustment expenses in Commercial Lines workers’
compensation business due to favorable severity and frequency.
• Net investment income of $3,264, before tax, in 2013 decreased from $4,127, before tax, in 2012. The decrease in net investment income is primarily
due to lower asset levels as a result of the sale of the Retirement Plans and Individual Life businesses in 2013, and a decline in yield.
• Net asbestos reserve strengthening of $130, before tax, in 2013 compared to $48, before tax, in 2012 resulting from the Company's annual review of its
asbestos liabilities. For further information, see MD&A - Critical Accounting Estimates, Property & Casualty Other Operations Claims with the Property
and Casualty Insurance Product Reserves, Net of Reinsurance.
• Differences between the Company's effective income tax rate and the U.S. statutory rate of 35% are due primarily to tax-exempt interest earned on
invested assets and the dividends received deduction ("DRD"). The $555 increase in income tax expense in 2013 compared to an income tax benefit in
2012 was primarily due to the $1.0 billion increase in income from continuing operations, before tax. Income tax expense of $246 in 2013 and income
tax benefit of $309 in 2012, includes separate account DRD benefits of $139 and $145, respectively.
36