The Hartford 2014 Annual Report Download - page 234
Download and view the complete annual report
Please find page 234 of the 2014 The Hartford annual report below. You can navigate through the pages in the report by either clicking on the pages listed below, or by using the keyword search tool below to find specific information within the annual report.-
 1
1 -
2
-
3
-
4
-
5
-
6
-
7
-
8
-
9
-
10
-
11
-
12
-
13
-
14
-
15
-
16
-
17
-
18
-
19
-
20
-
21
-
22
-
23
-
24
-
25
-
26
-
27
-
28
-
29
-
30
-
31
-
32
-
33
-
34
-
35
-
36
-
37
-
38
-
39
-
40
-
41
-
42
-
43
-
44
-
45
-
46
-
47
-
48
-
49
-
50
-
51
-
52
-
53
-
54
-
55
-
56
-
57
-
58
-
59
-
60
-
61
-
62
-
63
-
64
-
65
-
66
-
67
-
68
-
69
-
70
-
71
-
72
-
73
-
74
-
75
-
76
-
77
-
78
-
79
-
80
-
81
-
82
-
83
-
84
-
85
-
86
-
87
-
88
-
89
-
90
-
91
-
92
-
93
-
94
-
95
-
96
-
97
-
98
-
99
-
100
-
101
-
102
-
103
-
104
-
105
-
106
-
107
-
108
-
109
-
110
-
111
-
112
-
113
-
114
-
115
-
116
-
117
-
118
-
119
-
120
-
121
-
122
-
123
-
124
-
125
-
126
-
127
-
128
-
129
-
130
-
131
-
132
-
133
-
134
-
135
-
136
-
137
-
138
-
139
-
140
-
141
-
142
-
143
-
144
-
145
-
146
-
147
-
148
-
149
-
150
-
151
-
152
-
153
-
154
-
155
-
156
-
157
-
158
-
159
-
160
-
161
-
162
-
163
-
164
-
165
-
166
-
167
-
168
-
169
-
170
-
171
-
172
-
173
-
174
-
175
-
176
-
177
-
178
-
179
-
180
-
181
-
182
-
183
-
184
-
185
-
186
-
187
-
188
-
189
-
190
-
191
-
192
-
193
-
194
-
195
-
196
-
197
-
198
-
199
-
200
-
201
-
202
-
203
-
204
-
205
-
206
-
207
-
208
-
209
-
210
-
211
-
212
-
213
-
214
-
215
-
216
-
217
-
218
-
219
-
220
-
221
-
222
-
223
-
 224
224 -
 225
225 -
 226
226 -
 227
227 -
 228
228 -
 229
229 -
 230
230 -
 231
231 -
 232
232 -
 233
233 -
 234
234 -
 235
235 -
 236
236 -
 237
237 -
 238
238 -
 239
239 -
 240
240 -
 241
241 -
 242
242 -
 243
243 -
 244
244 -
245
-
246
-
247
-
248
-
249
-
250
-
251
-
252
-
253
-
254
-
255
-
256
-
257
-
258
-
259
-
260
-
261
-
262
-
263
-
264
-
265
-
266
-
267
-
268
-
269
-
270
-
271
-
272
-
273
-
274
-
275
-
276
-
277
-
278
-
279
-
280
-
281
-
282
-
283
-
284
-
285
-
286
-
287
-
288
-
289
-
290
-
291
-
292
-
293
-
294
-
295
-
296
 |
 |
Table of Contents
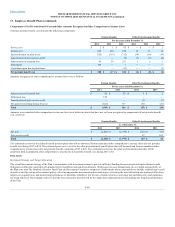
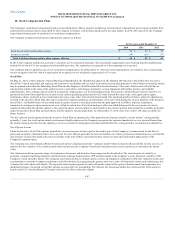
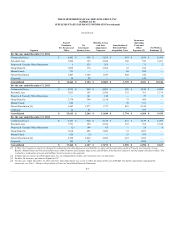
Expected dividend yield 1.7% 1.7% 1.3%
Expected annualized spot volatility 25.9% - 57.8% 31.1% - 48.1% 38.6% - 51.5%
Weighted average annualized volatility 35.1% 47.3% 51.4%
Risk-free spot rate 0.1% - 2.8% 0.1% - 1.9% 0.1% - 2.0%
Expected term 5.0 years 5.0 years 5.2 years
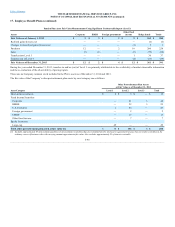
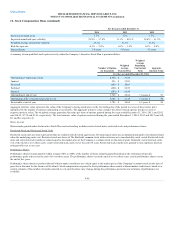
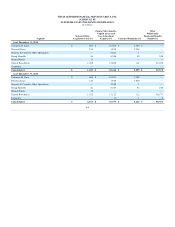
A summary of non-qualified stock option activity under the Company’s Incentive Stock Plan is presented below.
Outstanding at beginning of year 4,534 $ 36.34
Granted 925 $ 35.83
Exercised (603) $ 20.03
Forfeited (608) $ 68.53
Expired (503) $ 65.96
Outstanding at end of year 3,745 $ 29.64 7.4 years $ 53
Outstanding, fully vested and expected to vest 3,688 $ 27.18 7.4 years $ 50
Exercisable at end of year 1,705 $ 30.64 6.3 years $ 26
Aggregate intrinsic value represents the value of the Company's closing stock price on the last trading day of the period in excess of the exercise price
multiplied by the number of options outstanding or exercisable. The aggregate intrinsic value excludes the effect of stock options that have a zero or
negative intrinsic value. The weighted average grant-date fair value per share of options granted during the years ended December 31, 2014, 2013, and 2012
was $10.59, $7.78 and $7.41, respectively. The total intrinsic value of options exercised during the years ended December 31, 2014, 2013 and 2012 was $10,
$5, and $4, respectively.
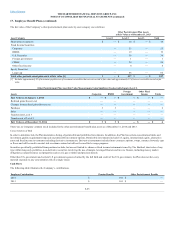
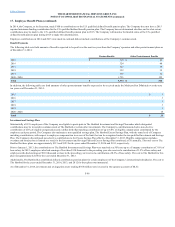
Share Awards
Share awards granted under the Incentive Stock Plan and outstanding include restricted stock units, restricted stock and performance shares.
Restricted Stock and Restricted Stock Units
Restricted stock units are share equivalents that are credited with dividend equivalents. Dividend equivalents are accumulated and paid in incremental shares
when the underlying units vest. Restricted stock are shares of The Hartford's common stock with restrictions as to transferability until vested. Restricted stock
units and restricted stock awards are valued equal to the market price of the Company’s common stock on the date of grant. Generally, restricted stock units
vest at the end of or over three years; certain restricted stock units vest at the end of 5 years. Restricted stock awards were granted to non employee directors
and generally vest in one year.
Performance Shares
Performance shares become payable within a range of 0% to 200% of the number of shares initially granted based upon the attainment of specific
performance goals achieved at the end of or over three years. The performance shares vest at the end of or over three years; certain performance shares vest at
the end of five years.
Performance share awards or portions thereof without market conditions are valued equal to the market price of the Company's common stock on the date of
grant less a discount for the absence of dividends. Stock-compensation expense for these performance share awards without market conditions is based on a
current estimate of the number of awards expected to vest and, therefore, may change during the performance period as new estimates of performance are
available.
F-98