The Hartford 2014 Annual Report Download - page 195
Download and view the complete annual report
Please find page 195 of the 2014 The Hartford annual report below. You can navigate through the pages in the report by either clicking on the pages listed below, or by using the keyword search tool below to find specific information within the annual report.-
 1
1 -
2
-
3
-
4
-
5
-
6
-
7
-
8
-
9
-
10
-
11
-
12
-
13
-
14
-
15
-
16
-
17
-
18
-
19
-
20
-
21
-
22
-
23
-
24
-
25
-
26
-
27
-
28
-
29
-
30
-
31
-
32
-
33
-
34
-
35
-
36
-
37
-
38
-
39
-
40
-
41
-
42
-
43
-
44
-
45
-
46
-
47
-
48
-
49
-
50
-
51
-
52
-
53
-
54
-
55
-
56
-
57
-
58
-
59
-
60
-
61
-
62
-
63
-
64
-
65
-
66
-
67
-
68
-
69
-
70
-
71
-
72
-
73
-
74
-
75
-
76
-
77
-
78
-
79
-
80
-
81
-
82
-
83
-
84
-
85
-
86
-
87
-
88
-
89
-
90
-
91
-
92
-
93
-
94
-
95
-
96
-
97
-
98
-
99
-
100
-
101
-
102
-
103
-
104
-
105
-
106
-
107
-
108
-
109
-
110
-
111
-
112
-
113
-
114
-
115
-
116
-
117
-
118
-
119
-
120
-
121
-
122
-
123
-
124
-
125
-
126
-
127
-
128
-
129
-
130
-
131
-
132
-
133
-
134
-
135
-
136
-
137
-
138
-
139
-
140
-
141
-
142
-
143
-
144
-
145
-
146
-
147
-
148
-
149
-
150
-
151
-
152
-
153
-
154
-
155
-
156
-
157
-
158
-
159
-
160
-
161
-
162
-
163
-
164
-
165
-
166
-
167
-
168
-
169
-
170
-
171
-
172
-
173
-
174
-
175
-
176
-
177
-
178
-
179
-
180
-
181
-
182
-
183
-
184
-
 185
185 -
 186
186 -
 187
187 -
 188
188 -
 189
189 -
 190
190 -
 191
191 -
 192
192 -
 193
193 -
 194
194 -
 195
195 -
 196
196 -
 197
197 -
 198
198 -
 199
199 -
 200
200 -
 201
201 -
 202
202 -
 203
203 -
 204
204 -
 205
205 -
206
-
207
-
208
-
209
-
210
-
211
-
212
-
213
-
214
-
215
-
216
-
217
-
218
-
219
-
220
-
221
-
222
-
223
-
224
-
225
-
226
-
227
-
228
-
229
-
230
-
231
-
232
-
233
-
234
-
235
-
236
-
237
-
238
-
239
-
240
-
241
-
242
-
243
-
244
-
245
-
246
-
247
-
248
-
249
-
250
-
251
-
252
-
253
-
254
-
255
-
256
-
257
-
258
-
259
-
260
-
261
-
262
-
263
-
264
-
265
-
266
-
267
-
268
-
269
-
270
-
271
-
272
-
273
-
274
-
275
-
276
-
277
-
278
-
279
-
280
-
281
-
282
-
283
-
284
-
285
-
286
-
287
-
288
-
289
-
290
-
291
-
292
-
293
-
294
-
295
-
296
 |
 |

Table of Contents
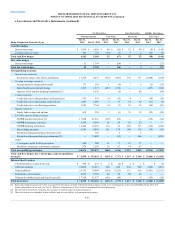
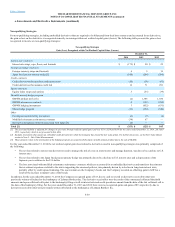
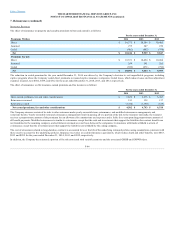
For non-qualifying strategies, including embedded derivatives that are required to be bifurcated from their host contracts and accounted for as derivatives,
the gain or loss on the derivative is recognized currently in earnings within net realized capital gains (losses). The following table presents the gain or loss
recognized in income on non-qualifying strategies:
Interest rate contracts
Interest rate swaps, caps, floors, and forwards $ (172) $ 50 $ 22
Foreign exchange contracts
Foreign currency swaps and forwards 6 5 19
Japan fixed payout annuity hedge [1] (148) (268) (300)
Credit contracts
Credit derivatives that purchase credit protection (10) (38) (61)
Credit derivatives that assume credit risk 16 71 291
Equity contracts
Equity index swaps and options 3 (33) (39)
Variable annuity hedge program
GMWB product derivative (2) 1,306 1,430
GMWB reinsurance contracts 4 (192) (280)
GMWB hedging instruments 3 (852) (631)
Macro hedge program (11) (234) (340)
Other
Contingent capital facility put option (6) (7) (6)
Modified coinsurance reinsurance contracts (34) 67 —
Derivative instruments formerly associated with Japan [3] (2) — —
[1] The associated liability is adjusted for changes in spot rates through realized capital gains and was $116, $250 and $189 for the years ended December 31, 2014, 2013 and
2012, respectively, which is not presented in this table
[2] Excludes investments that contain an embedded credit derivative for which the Company has elected the fair value option. For further discussion, see the Fair Value Option
section in Note 5 - Fair Value Measurements.
[3] These amounts relate to the termination of the hedging program associated with the Japan variable annuity product due to the sale of HLIKK.
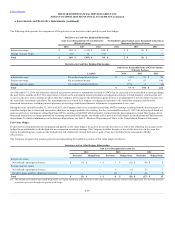
For the year ended December 31, 2014 the net realized capital gain (loss) related to derivatives used in non-qualifying strategies was primarily comprised of
the following:
• The net loss related to interest rate derivatives used to manage the risk of a rise in interest rates and manage duration, was driven by a decline in U.S.
interest rates.
• The net loss related to the Japan fixed payout annuity hedge was primarily driven by a decline in U.S. interest rates and a depreciation of the
Japanese yen in relation to the U.S. dollar.
• The loss associated with modified coinsurance reinsurance contracts, which are accounted for as embedded derivatives and transfer to the reinsurer
the investment experience related to the assets supporting the reinsured policies, was primarily driven by a decline in long-term interest rates,
partially offset by credit spread widening. The assets remain on the Company's books and the Company recorded an offsetting gain in AOCI as a
result of the increase in market value of the bonds.
In addition, for the year ended December 31, 2014 the Company recognized gains of $13, due to cash recovered on derivative receivables that were
previously written-off related to the bankruptcy of Lehman Brothers Inc. The derivative receivables were the result of the contractual collateral threshold
amounts and open collateral calls prior to the bankruptcy filing as well as interest rate and credit spread movements from the date of the last collateral call to
the date of the bankruptcy filing. For the years ended December 31, 2013 and 2012 there were no recognized gains and gains of $9, respectively, due to
derivative receivables that were previously written-off related to the bankruptcy of Lehman Brothers Inc.
F-59