The Hartford 2014 Annual Report Download - page 46
Download and view the complete annual report
Please find page 46 of the 2014 The Hartford annual report below. You can navigate through the pages in the report by either clicking on the pages listed below, or by using the keyword search tool below to find specific information within the annual report.-
 1
1 -
2
-
3
-
4
-
5
-
6
-
7
-
8
-
9
-
10
-
11
-
12
-
13
-
14
-
15
-
16
-
17
-
18
-
19
-
20
-
21
-
22
-
23
-
24
-
25
-
26
-
27
-
28
-
29
-
30
-
31
-
32
-
33
-
34
-
35
-
 36
36 -
 37
37 -
 38
38 -
 39
39 -
 40
40 -
 41
41 -
 42
42 -
 43
43 -
 44
44 -
 45
45 -
 46
46 -
 47
47 -
 48
48 -
 49
49 -
 50
50 -
 51
51 -
 52
52 -
 53
53 -
 54
54 -
 55
55 -
 56
56 -
57
-
58
-
59
-
60
-
61
-
62
-
63
-
64
-
65
-
66
-
67
-
68
-
69
-
70
-
71
-
72
-
73
-
74
-
75
-
76
-
77
-
78
-
79
-
80
-
81
-
82
-
83
-
84
-
85
-
86
-
87
-
88
-
89
-
90
-
91
-
92
-
93
-
94
-
95
-
96
-
97
-
98
-
99
-
100
-
101
-
102
-
103
-
104
-
105
-
106
-
107
-
108
-
109
-
110
-
111
-
112
-
113
-
114
-
115
-
116
-
117
-
118
-
119
-
120
-
121
-
122
-
123
-
124
-
125
-
126
-
127
-
128
-
129
-
130
-
131
-
132
-
133
-
134
-
135
-
136
-
137
-
138
-
139
-
140
-
141
-
142
-
143
-
144
-
145
-
146
-
147
-
148
-
149
-
150
-
151
-
152
-
153
-
154
-
155
-
156
-
157
-
158
-
159
-
160
-
161
-
162
-
163
-
164
-
165
-
166
-
167
-
168
-
169
-
170
-
171
-
172
-
173
-
174
-
175
-
176
-
177
-
178
-
179
-
180
-
181
-
182
-
183
-
184
-
185
-
186
-
187
-
188
-
189
-
190
-
191
-
192
-
193
-
194
-
195
-
196
-
197
-
198
-
199
-
200
-
201
-
202
-
203
-
204
-
205
-
206
-
207
-
208
-
209
-
210
-
211
-
212
-
213
-
214
-
215
-
216
-
217
-
218
-
219
-
220
-
221
-
222
-
223
-
224
-
225
-
226
-
227
-
228
-
229
-
230
-
231
-
232
-
233
-
234
-
235
-
236
-
237
-
238
-
239
-
240
-
241
-
242
-
243
-
244
-
245
-
246
-
247
-
248
-
249
-
250
-
251
-
252
-
253
-
254
-
255
-
256
-
257
-
258
-
259
-
260
-
261
-
262
-
263
-
264
-
265
-
266
-
267
-
268
-
269
-
270
-
271
-
272
-
273
-
274
-
275
-
276
-
277
-
278
-
279
-
280
-
281
-
282
-
283
-
284
-
285
-
286
-
287
-
288
-
289
-
290
-
291
-
292
-
293
-
294
-
295
-
296
 |
 |

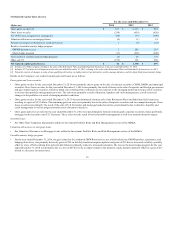
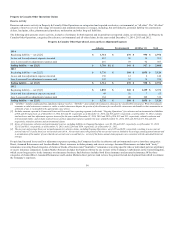
The following discussion includes disclosure of possible variation from current estimates of loss reserves due to a change in certain key indicators of
potential losses. Each of the impacts described below is estimated individually, without consideration for any correlation among key indicators or among
lines of business. Therefore, it would be inappropriate to take each of the amounts described below and add them together in an attempt to estimate volatility
for the Company’s reserves in total. The estimated variation in reserves due to changes in key indicators is a reasonable estimate of possible variation that
may occur in the future, likely over a period of several calendar years. It is important to note that the variation discussed is not meant to be a worst-case
scenario, and therefore, it is possible that future variation may be more than the amounts discussed below.
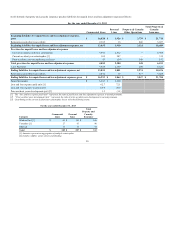
Recorded reserves for auto liability, net of reinsurance, are approximately $2.1 billion across all lines, $1.4 billion of which is in Personal Lines. Personal
auto liability reserves are shorter-tailed than other lines of business (such as workers’ compensation) and, therefore, less volatile. However, the size of the
reserve base means that future changes in estimates could be material to the Company’s results of operations in any given period. The key indicator for
Personal Lines auto liability is the annual loss cost trend, particularly the severity trend component of loss costs. A 2.5 point change in annual severity for the
two most recent accident years would change the estimated net reserve need by $80, in either direction. A 2.5 point change in annual severity is within the
Company’s historical variation.
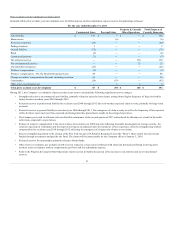
Recorded reserves for workers’ compensation, net of reinsurance, are approximately $8.7 billion. Loss development patterns are a key indicator for this line of
business, particularly for more mature accident years. Historically, loss development patterns have been impacted by, among other things, medical cost
inflation and other changes in loss cost trends. The Company has reviewed the historical variation in paid loss development patterns. If the paid loss
development patterns change by 2%, the estimated net reserve need would change by $400, in either direction. A 2% change in paid loss development
patterns is within the Company’s historical variation, as measured by the variation around the average development factors as reported in statutory accident
year reports.
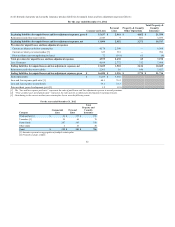
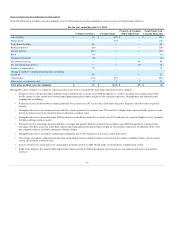
Recorded reserves for general liability, net of reinsurance, are approximately $2.5 billion. Loss development patterns are a key indicator for this line of
business, particularly for more mature accident years. Historically, loss development patterns have been impacted by, among other things, emergence of new
types of claims (e.g., construction defect claims) or a shift in the mixture between smaller, more routine claims and larger, more complex claims. The
Company has reviewed the historical variation in reported loss development patterns. If the reported loss development patterns change by 10%, the estimated
net reserve need would change by $200, in either direction. A 10% change in reported loss development patterns is within the Company’s historical
variation, as measured by the variation around the average development factors as reported in statutory accident year reports.
How A&E reserves are set
In establishing reserves for asbestos claims, the Company evaluates its insureds’ estimated liabilities for such claims using a ground-up approach. The
Company considers a variety of factors, including the jurisdictions where underlying claims have been brought, past, pending and anticipated future claim
activity, disease mix, past settlement values of similar claims, dismissal rates, allocated loss adjustment expense, and potential bankruptcy impact.
Similarly, a ground-up exposure review approach is used to establish environmental reserves. The Company’s evaluation of its insureds’ estimated liabilities
for environmental claims involves consideration of several factors, including historical values of similar claims, the number of sites involved, the insureds’
alleged activities at each site, the alleged environmental damage at each site, the respective shares of liability of potentially responsible parties at each site,
the appropriateness and cost of remediation at each site, the nature of governmental enforcement activities at each site, and potential bankruptcy impact.
Having evaluated its insureds’ probable liabilities for asbestos and/or environmental claims, the Company then evaluates its insureds’ insurance coverage
programs for such claims. The Company considers its insureds’ total available insurance coverage, including the coverage issued by the Company. The
Company also considers relevant judicial interpretations of policy language and applicable coverage defenses or determinations, if any.
Evaluation of both the insureds’ estimated liabilities and the Company’s exposure to the insureds depends heavily on an analysis of the relevant legal issues
and litigation environment. This analysis is conducted by the Company’s lawyers and is subject to applicable privileges.
For both asbestos and environmental reserves, the Company also compares its historical direct net loss and expense paid and reported experience, and net
loss and expense paid and reported experience year by year, to assess any emerging trends, fluctuations or characteristics suggested by the aggregate paid and
reported activity.
Once the gross ultimate exposure for indemnity and allocated loss adjustment expense is determined for its insureds by each policy year, the Company
calculates its ceded reinsurance projection based on any applicable facultative and treaty reinsurance and the Company’s experience with reinsurance
collections.
46