The Hartford 2014 Annual Report Download - page 190
Download and view the complete annual report
Please find page 190 of the 2014 The Hartford annual report below. You can navigate through the pages in the report by either clicking on the pages listed below, or by using the keyword search tool below to find specific information within the annual report.-
 1
1 -
2
-
3
-
4
-
5
-
6
-
7
-
8
-
9
-
10
-
11
-
12
-
13
-
14
-
15
-
16
-
17
-
18
-
19
-
20
-
21
-
22
-
23
-
24
-
25
-
26
-
27
-
28
-
29
-
30
-
31
-
32
-
33
-
34
-
35
-
36
-
37
-
38
-
39
-
40
-
41
-
42
-
43
-
44
-
45
-
46
-
47
-
48
-
49
-
50
-
51
-
52
-
53
-
54
-
55
-
56
-
57
-
58
-
59
-
60
-
61
-
62
-
63
-
64
-
65
-
66
-
67
-
68
-
69
-
70
-
71
-
72
-
73
-
74
-
75
-
76
-
77
-
78
-
79
-
80
-
81
-
82
-
83
-
84
-
85
-
86
-
87
-
88
-
89
-
90
-
91
-
92
-
93
-
94
-
95
-
96
-
97
-
98
-
99
-
100
-
101
-
102
-
103
-
104
-
105
-
106
-
107
-
108
-
109
-
110
-
111
-
112
-
113
-
114
-
115
-
116
-
117
-
118
-
119
-
120
-
121
-
122
-
123
-
124
-
125
-
126
-
127
-
128
-
129
-
130
-
131
-
132
-
133
-
134
-
135
-
136
-
137
-
138
-
139
-
140
-
141
-
142
-
143
-
144
-
145
-
146
-
147
-
148
-
149
-
150
-
151
-
152
-
153
-
154
-
155
-
156
-
157
-
158
-
159
-
160
-
161
-
162
-
163
-
164
-
165
-
166
-
167
-
168
-
169
-
170
-
171
-
172
-
173
-
174
-
175
-
176
-
177
-
178
-
179
-
 180
180 -
 181
181 -
 182
182 -
 183
183 -
 184
184 -
 185
185 -
 186
186 -
 187
187 -
 188
188 -
 189
189 -
 190
190 -
 191
191 -
 192
192 -
 193
193 -
 194
194 -
 195
195 -
 196
196 -
 197
197 -
 198
198 -
 199
199 -
 200
200 -
201
-
202
-
203
-
204
-
205
-
206
-
207
-
208
-
209
-
210
-
211
-
212
-
213
-
214
-
215
-
216
-
217
-
218
-
219
-
220
-
221
-
222
-
223
-
224
-
225
-
226
-
227
-
228
-
229
-
230
-
231
-
232
-
233
-
234
-
235
-
236
-
237
-
238
-
239
-
240
-
241
-
242
-
243
-
244
-
245
-
246
-
247
-
248
-
249
-
250
-
251
-
252
-
253
-
254
-
255
-
256
-
257
-
258
-
259
-
260
-
261
-
262
-
263
-
264
-
265
-
266
-
267
-
268
-
269
-
270
-
271
-
272
-
273
-
274
-
275
-
276
-
277
-
278
-
279
-
280
-
281
-
282
-
283
-
284
-
285
-
286
-
287
-
288
-
289
-
290
-
291
-
292
-
293
-
294
-
295
-
296
 |
 |

Table of Contents
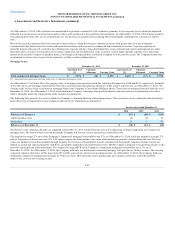
Modified coinsurance reinsurance contracts
As of December 31, 2014 and 2013, the Company had approximately $1.0 billion and $1.3 billion, respectively, of invested assets supporting other
policyholder funds and benefits payable reinsured under a modified coinsurance arrangement in connection with the sale of the Individual Life business
structured as a reinsurance transaction. The assets are primarily held in a trust established by the Company. The Company pays or receives cash quarterly to
settle the results of the reinsured business, including the investment results. As a result of this modified coinsurance arrangement, the Company has an
embedded derivative that transfers to the reinsurer certain unrealized changes in fair value due to interest rate and credit risks of these assets. The notional
amounts of the embedded derivative reinsurance contracts are the invested assets that are carried at fair value supporting the reinsured reserves.
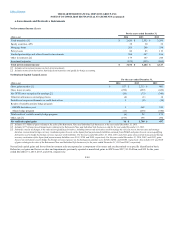
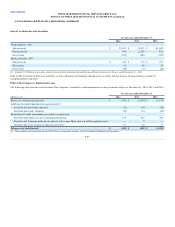
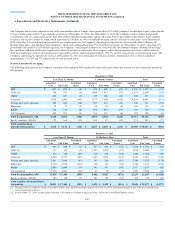
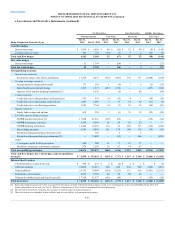
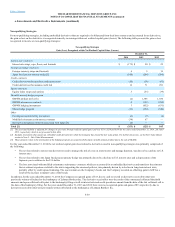
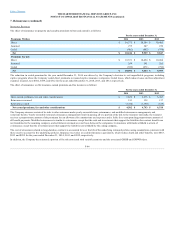
The following table summarizes the balance sheet classification of the Company’s derivative related fair value amounts as well as the gross asset and liability
fair value amounts. For reporting purposes, the Company has elected to offset the fair value amounts, income accruals, and related cash collateral receivables
and payables of OTC derivative instruments executed in a legal entity and with the same counterparty under a master netting agreement, which provides the
Company with the legal right of offset. The Company has also elected to offset the fair value amounts, income accruals and related cash collateral receivables
and payables of OTC-cleared derivative instruments based on clearing house agreements. The fair value amounts presented below do not include income
accruals or related cash collateral receivables and payables, which are netted with derivative fair value amounts to determine balance sheet presentation.
Derivative fair value reported as liabilities after taking into account the master netting agreements, is $1.1 billion and $1.3 billion as of December 31, 2014
and 2013, respectively. Derivatives in the Company’s separate accounts where the associated gains and losses accrue directly to policyholders are not
included. The Company’s derivative instruments are held for risk management purposes, unless otherwise noted in the following table. The notional amount
of derivative contracts represents the basis upon which pay or receive amounts are calculated and is presented in the table to quantify the volume of the
Company’s derivative activity. Notional amounts are not necessarily reflective of credit risk. The tables below exclude investments that contain an
embedded credit derivative for which the Company has elected the fair value option. For further discussion, see the Fair Value Option section in Note 5 - Fair
Value Measurements of Notes to the Consolidated Financial Statements.
F-54