The Hartford 2014 Annual Report Download - page 177
Download and view the complete annual report
Please find page 177 of the 2014 The Hartford annual report below. You can navigate through the pages in the report by either clicking on the pages listed below, or by using the keyword search tool below to find specific information within the annual report.-
 1
1 -
2
-
3
-
4
-
5
-
6
-
7
-
8
-
9
-
10
-
11
-
12
-
13
-
14
-
15
-
16
-
17
-
18
-
19
-
20
-
21
-
22
-
23
-
24
-
25
-
26
-
27
-
28
-
29
-
30
-
31
-
32
-
33
-
34
-
35
-
36
-
37
-
38
-
39
-
40
-
41
-
42
-
43
-
44
-
45
-
46
-
47
-
48
-
49
-
50
-
51
-
52
-
53
-
54
-
55
-
56
-
57
-
58
-
59
-
60
-
61
-
62
-
63
-
64
-
65
-
66
-
67
-
68
-
69
-
70
-
71
-
72
-
73
-
74
-
75
-
76
-
77
-
78
-
79
-
80
-
81
-
82
-
83
-
84
-
85
-
86
-
87
-
88
-
89
-
90
-
91
-
92
-
93
-
94
-
95
-
96
-
97
-
98
-
99
-
100
-
101
-
102
-
103
-
104
-
105
-
106
-
107
-
108
-
109
-
110
-
111
-
112
-
113
-
114
-
115
-
116
-
117
-
118
-
119
-
120
-
121
-
122
-
123
-
124
-
125
-
126
-
127
-
128
-
129
-
130
-
131
-
132
-
133
-
134
-
135
-
136
-
137
-
138
-
139
-
140
-
141
-
142
-
143
-
144
-
145
-
146
-
147
-
148
-
149
-
150
-
151
-
152
-
153
-
154
-
155
-
156
-
157
-
158
-
159
-
160
-
161
-
162
-
163
-
164
-
165
-
166
-
 167
167 -
 168
168 -
 169
169 -
 170
170 -
 171
171 -
 172
172 -
 173
173 -
 174
174 -
 175
175 -
 176
176 -
 177
177 -
 178
178 -
 179
179 -
 180
180 -
 181
181 -
 182
182 -
 183
183 -
 184
184 -
 185
185 -
 186
186 -
 187
187 -
188
-
189
-
190
-
191
-
192
-
193
-
194
-
195
-
196
-
197
-
198
-
199
-
200
-
201
-
202
-
203
-
204
-
205
-
206
-
207
-
208
-
209
-
210
-
211
-
212
-
213
-
214
-
215
-
216
-
217
-
218
-
219
-
220
-
221
-
222
-
223
-
224
-
225
-
226
-
227
-
228
-
229
-
230
-
231
-
232
-
233
-
234
-
235
-
236
-
237
-
238
-
239
-
240
-
241
-
242
-
243
-
244
-
245
-
246
-
247
-
248
-
249
-
250
-
251
-
252
-
253
-
254
-
255
-
256
-
257
-
258
-
259
-
260
-
261
-
262
-
263
-
264
-
265
-
266
-
267
-
268
-
269
-
270
-
271
-
272
-
273
-
274
-
275
-
276
-
277
-
278
-
279
-
280
-
281
-
282
-
283
-
284
-
285
-
286
-
287
-
288
-
289
-
290
-
291
-
292
-
293
-
294
-
295
-
296
 |
 |
Table of Contents
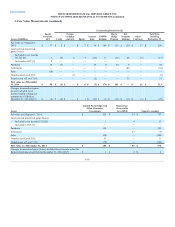
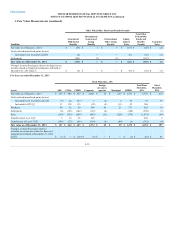
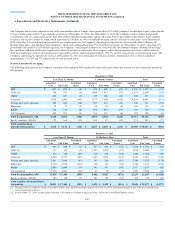
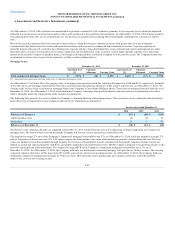
Fair value as of January 1, 2013 $ (1,249) $ (50) $ 2 $ (7) $ (1,304) $ (2)
Total realized/unrealized gains (losses)
Included in net income [1] [2] [6] 1,306 13 3 (10) 1,312 —
Settlements (93) 40 (2) (1) (56) —
Changes in unrealized gains (losses) included in net
income related to financial instruments still held at
December 31, 2013 [2] [7] $ 1,306 $ 13 $ 3 $ (10) $ 1,312 $ —
[1] The Company classifies gains and losses on GMWB reinsurance derivatives and GMWB embedded derivatives as unrealized gains (losses) for purposes of disclosure in this
table because it is impracticable to track on a contract-by-contract basis the realized gains (losses) for these derivatives and embedded derivatives.
[2] All amounts in these rows are reported in net realized capital gains/losses. The realized/unrealized gains (losses) included in net income for separate account assets are
offset by an equal amount for separate account liabilities, which results in a net zero impact on net income for the Company. All amounts are before income taxes and
amortization DAC.
[3] All amounts are before income taxes and amortization of DAC.
[4] Transfers in and/or (out) of Level 3 are primarily attributable to the availability of market observable information and the re-evaluation of the observability of pricing inputs.
[5] Derivative instruments are reported in this table on a net basis for asset/(liability) positions and reported in the Consolidated Balance Sheets in other investments and other
liabilities.
[6] Includes both market and non-market impacts in deriving realized and unrealized gains (losses).
[7] Amounts presented are for Level 3 only and therefore may not agree to other disclosures included herein.
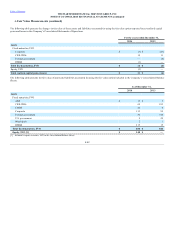
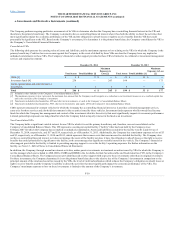
Fair Value Option
The Company classifies the underlying fixed maturities held in certain consolidated investment funds within the Fixed Maturities, FVO line on the
Consolidated Balance Sheets. The Company reports consolidated investment companies at fair value with changes in the fair value of these securities
recognized in net realized capital gains and losses, which is consistent with accounting requirements for investment companies. The investment funds hold
fixed income securities in multiple sectors and the Company has management and control of the funds as well as a significant ownership interest.
FVO investments also include certain securities that contain embedded credit derivatives with underlying credit risk primarily related to residential and
commercial real estate.
The Company also elected the fair value option for certain equity securities in order to align the accounting with total return swap contracts that hedge the
risk associated with the investments. The swaps do not qualify for hedge accounting and the change in value of both the equity securities and the total return
swap are recorded in net realized capital gains and losses. These equity securities are classified within equity securities, AFS on the Consolidated Balance
Sheets. Income earned from FVO securities is recorded in net investment income and changes in fair value are recorded in net realized capital gains and
losses.
The Company previously held fair value option investments in foreign government securities that aligned with the accounting for yen-based fixed annuity
liabilities, which are adjusted for changes in foreign-exchange spot rates. These investments were previously held in a U.S. subsidiary and were disposed of as
a consequence of the recapture of certain risks by HLIKK. For further discussion on the sale, see the Sale of Hartford Life Insurance KK section in Note 2 -
Business Dispositions of Notes to Consolidated Financial Statements. The change in fair value on these investments was previously recorded as a component
of net realized capital gains and losses, but has been reclassified to discontinued operations.
F-41