The Hartford 2014 Annual Report Download - page 84
Download and view the complete annual report
Please find page 84 of the 2014 The Hartford annual report below. You can navigate through the pages in the report by either clicking on the pages listed below, or by using the keyword search tool below to find specific information within the annual report.-
 1
1 -
2
-
3
-
4
-
5
-
6
-
7
-
8
-
9
-
10
-
11
-
12
-
13
-
14
-
15
-
16
-
17
-
18
-
19
-
20
-
21
-
22
-
23
-
24
-
25
-
26
-
27
-
28
-
29
-
30
-
31
-
32
-
33
-
34
-
35
-
36
-
37
-
38
-
39
-
40
-
41
-
42
-
43
-
44
-
45
-
46
-
47
-
48
-
49
-
50
-
51
-
52
-
53
-
54
-
55
-
56
-
57
-
58
-
59
-
60
-
61
-
62
-
63
-
64
-
65
-
66
-
67
-
68
-
69
-
70
-
71
-
72
-
73
-
 74
74 -
 75
75 -
 76
76 -
 77
77 -
 78
78 -
 79
79 -
 80
80 -
 81
81 -
 82
82 -
 83
83 -
 84
84 -
 85
85 -
 86
86 -
 87
87 -
 88
88 -
 89
89 -
 90
90 -
 91
91 -
 92
92 -
 93
93 -
 94
94 -
95
-
96
-
97
-
98
-
99
-
100
-
101
-
102
-
103
-
104
-
105
-
106
-
107
-
108
-
109
-
110
-
111
-
112
-
113
-
114
-
115
-
116
-
117
-
118
-
119
-
120
-
121
-
122
-
123
-
124
-
125
-
126
-
127
-
128
-
129
-
130
-
131
-
132
-
133
-
134
-
135
-
136
-
137
-
138
-
139
-
140
-
141
-
142
-
143
-
144
-
145
-
146
-
147
-
148
-
149
-
150
-
151
-
152
-
153
-
154
-
155
-
156
-
157
-
158
-
159
-
160
-
161
-
162
-
163
-
164
-
165
-
166
-
167
-
168
-
169
-
170
-
171
-
172
-
173
-
174
-
175
-
176
-
177
-
178
-
179
-
180
-
181
-
182
-
183
-
184
-
185
-
186
-
187
-
188
-
189
-
190
-
191
-
192
-
193
-
194
-
195
-
196
-
197
-
198
-
199
-
200
-
201
-
202
-
203
-
204
-
205
-
206
-
207
-
208
-
209
-
210
-
211
-
212
-
213
-
214
-
215
-
216
-
217
-
218
-
219
-
220
-
221
-
222
-
223
-
224
-
225
-
226
-
227
-
228
-
229
-
230
-
231
-
232
-
233
-
234
-
235
-
236
-
237
-
238
-
239
-
240
-
241
-
242
-
243
-
244
-
245
-
246
-
247
-
248
-
249
-
250
-
251
-
252
-
253
-
254
-
255
-
256
-
257
-
258
-
259
-
260
-
261
-
262
-
263
-
264
-
265
-
266
-
267
-
268
-
269
-
270
-
271
-
272
-
273
-
274
-
275
-
276
-
277
-
278
-
279
-
280
-
281
-
282
-
283
-
284
-
285
-
286
-
287
-
288
-
289
-
290
-
291
-
292
-
293
-
294
-
295
-
296
 |
 |

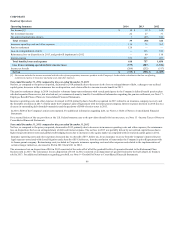
2015 Outlook
The principal goal for Talcott Resolution is to reduce the size and risk associated with the Company's in-force variable annuities. As a result, the Company
expects account values and consequently earnings to decline due to surrenders, policyholder initiatives or transactions with third parties, that will reduce the
size of this legacy book of business. Risk-reducing transactions may also cause a reduction in statutory capital and shareholders’ equity.
As the Company's annuity book continues to run off, earnings will continue to decline. A key driver to the decline in earnings will be the pace at which
customers surrender their contracts. In 2014, the Company continued to experience double digit variable annuities surrender rates driven by market
appreciation, continued aging of the block and in-force management initiatives. Contract counts decreased 13% for variable annuities in 2014. Looking
forward, the Company expects variable annuity surrender rates to decline in 2015, as 2014 included the effect of in-force management initiatives. The
decline in policy counts will likely result in unit cost increases and margin compression because expenses will not reduce at the same pace as the annuity
block, further contributing to a decline in earnings over time.
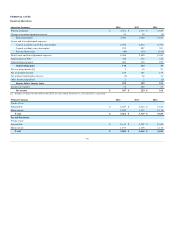
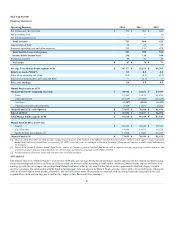
Year ended December 31, 2014 compared to the year ended December 31, 2013
The net loss for the year ended December 31, 2014 decreased compared to the net loss for the year ended December 31, 2013 primarily due to the decrease in
the loss from discontinued operations, net of tax, related to the sale of HLIKK. Also contributing to the decrease in net loss were lower amortization of DAC,
and lower insurance operating costs and other expenses, including lower costs associated with the enhanced surrender value program, and higher income
from limited partnerships and other alternative investments, partially offset by a decline in earned fee income attributable to the continued run off of the
business, and a decline in net investment income excluding that from limited partnerships and other alternative investments.
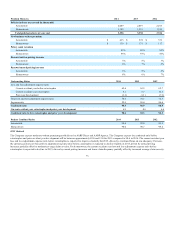
Account values for Talcott Resolution decreased to approximately $185 billion at year ended December 31, 2014 from approximately $219 billion at year
ended December 31, 2013 due primarily to the sale of HLIKK, and net outflows partially offset by market value appreciation in variable annuities. For the
year ended December 31, 2014 variable annuity net outflows decreased by approximately $2.9 billion as compared to the prior year period due to lower
outflows from in-force management initiatives.
For the year ended December 31, 2014 the annualized full surrender rate on variable annuities declined to 13.5% compared to 16.7% for the year ended
December 31, 2013. This decline was primarily due to lower surrenders from in-force management initiatives.
Contract counts decreased 13% for variable annuities at year ended December 31, 2014 compared to year ended December 31, 2013 primarily due to market
appreciation, in-force management initiatives and the continued aging of the block.
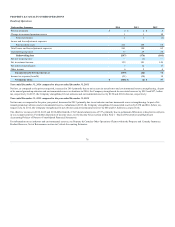
The effective tax rates in 2014 and 2013 differ from the U.S. Federal statutory rate of 35% primarily due to permanent differences related to investments in
separate account DRD. For further discussion of income taxes, see Note 13 - Income Taxes of Notes to Consolidated Financial Statements.
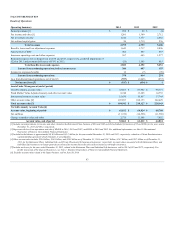
Year ended December 31, 2013 compared to the year ended December 31, 2012
The net loss for the year ended December 31, 2013 was primarily driven by Unlock charges of $806, before tax, during the current year period compared to an
Unlock benefit of $47, before tax, in the prior year period. The Unlock charge for the year ended 2013 includes a charge of $887, before tax, for hedge cost
assumption changes associated with expanding the Japan variable annuity hedging program in the first quarter of 2013. In addition, variable annuity hedge
program losses for the year ended 2013 were $1,558, before tax, including international losses of $1,586, compared to losses of $1,288 before tax, including
international losses of $1,467, for the prior year period.
Lower fee income in 2013 due to the continued runoff of the variable annuity business, as well as costs associated with an enhanced surrender value program
in the U.S., also contributed to the net loss for the year ended December 31, 2013. In addition, 2012 results of operations reflect the reinsurance loss on
disposition related to the disposition of the Individual Life business, and losses in 2012 from the operations of the Retirement Plans and Individual Life
businesses sold in 2013.
For further discussion of investment results and the results of the variable annuity hedge program, see MD&A – Investment Results, Net Investment Income
(Loss) and Net Realized Capital Gains (Losses). For further discussion of Unlocks, see MD&A - Critical Accounting Estimates, Estimated Gross Profits Used
in the Valuation and Amortization of Assets and Liabilities Associated with Variable Annuity and Other Universal Life-Type Contracts.
The 2013 and 2012 effective tax rates differ from the U.S. Federal statutory rate of 35% primarily due to permanent differences related to investments in
separate account DRD. For further discussion of income taxes, see Note 13 - Income Taxes of Notes to Consolidated Financial Statements.
84