Telus 2010 Annual Report Download - page 90
Download and view the complete annual report
Please find page 90 of the 2010 Telus annual report below. You can navigate through the pages in the report by either clicking on the pages listed below, or by using the keyword search tool below to find specific information within the annual report.-
 1
1 -
2
-
3
-
4
-
5
-
6
-
7
-
8
-
9
-
10
-
11
-
12
-
13
-
14
-
15
-
16
-
17
-
18
-
19
-
20
-
21
-
22
-
23
-
24
-
25
-
26
-
27
-
28
-
29
-
30
-
31
-
32
-
33
-
34
-
35
-
36
-
37
-
38
-
39
-
40
-
41
-
42
-
43
-
44
-
45
-
46
-
47
-
48
-
49
-
50
-
51
-
52
-
53
-
54
-
55
-
56
-
57
-
58
-
59
-
60
-
61
-
62
-
63
-
64
-
65
-
66
-
67
-
68
-
69
-
70
-
71
-
72
-
73
-
74
-
75
-
76
-
77
-
78
-
79
-
 80
80 -
 81
81 -
 82
82 -
 83
83 -
 84
84 -
 85
85 -
 86
86 -
 87
87 -
 88
88 -
 89
89 -
 90
90 -
 91
91 -
 92
92 -
 93
93 -
 94
94 -
 95
95 -
 96
96 -
 97
97 -
 98
98 -
 99
99 -
 100
100 -
101
-
102
-
103
-
104
-
105
-
106
-
107
-
108
-
109
-
110
-
111
-
112
-
113
-
114
-
115
-
116
-
117
-
118
-
119
-
120
-
121
-
122
-
123
-
124
-
125
-
126
-
127
-
128
-
129
-
130
-
131
-
132
-
133
-
134
-
135
-
136
-
137
-
138
-
139
-
140
-
141
-
142
-
143
-
144
-
145
-
146
-
147
-
148
-
149
-
150
-
151
-
152
-
153
-
154
-
155
-
156
-
157
-
158
-
159
-
160
-
161
-
162
-
163
-
164
-
165
-
166
-
167
-
168
-
169
-
170
-
171
-
172
-
173
-
174
-
175
-
176
-
177
-
178
-
179
-
180
-
181
-
182
 |
 |

86 . TELUS 2010 annual report
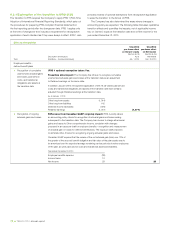
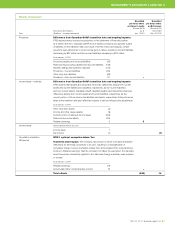
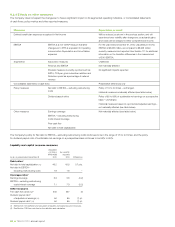
8.2.4 Effects on other measures
The Company does not expect the changeover to have a significant impact on its segmented operating indicators, or Consolidated statements
of cash flows, policy metrics and other reported measures.
Measures Expectation or result
Defined benefit plan expenses recognized in Net income Will be reduced, as shown in the previous section, and will
experience lower volatility after changeover, as actuarial gains
and losses will be charged to Other comprehensive income.
EBITDA EBITDA is a non-GAAP measure that after
changeover to IFRS is equivalent to Operating
income before Depreciation and Amortization
expenses
For the year ended December 31, 2010, unaudited pro forma
EBITDA is $3,650 million, as compared to $3,643 million
currently measured and reported. See Section 11.1 for additional
information on the transition differences in the measurement
of 2010 EBITDA.
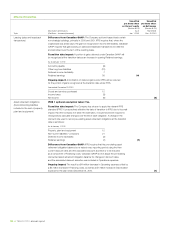
Segmented Subscriber measures Unaffected
Revenue and EBITDA Not materially affected
Wireless measures currently reported such as
ARPU, COA per gross subscriber addition and
Retention spend as a percentage of network
revenue
No significant impacts expected
Consolidated statements of cash flows Presentation differences only
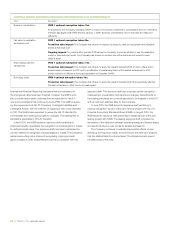
Policy measures Net debt to EBITDA – excluding restructuring
costs
Policy of 1.5 to 2.0 times – unchanged.
Historical measure immaterially affected (see table below).
Dividend payout ratios Policy of 55 to 65% of sustainable net earnings on a prospective
basis – unchanged.
Historical measures based on reported and adjusted earnings –
not materially affected (see table below).
Other measures Earnings coverage
EBITDA – excluding restructuring
costs interest coverage
Free cash flow
Net debt to total capitalization
Not materially affected (see table below).
The Company’s policy for Net debt to EBITDA – excluding restructuring costs continues to be in the range of 1.5 to 2.0 times, and the policy
for dividend payout ratio of sustainable net earnings on a prospective basis continues to be 55% to 65%.
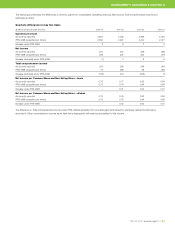
Liquidity and capital resource measures
Unaudited
pro forma As currently
IFRS-IASB reported
As at, or years ended, December 31 2010 2010 Differences
Debt ratios(1)
Net debt to total capitalization (%) 46.2 45.5 0.7 pts.
Net debt to EBITDA –
excluding restructuring costs 1.8 1.8 –
Coverage ratios(1)
Earnings coverage 3.6 3.8 (0.2)
EBITDA – excluding restructuring
costs interest coverage 7.1 7.3 (0.2)
Other measures
Free cash flow ($ millions)(2) 940 947 (7)
Dividend payout ratio(1)
of adjusted net earnings (%) 64 65 (1) pt.
Dividend payout ratio(1) (%) 64 65 (1) pt.
(1) See Section 11.4 Definition and calculation of liquidity and capital resource measures.
(2) See Section 11.2 Free cash flow for the definition and calculation.