Telus 2010 Annual Report Download - page 4
Download and view the complete annual report
Please find page 4 of the 2010 Telus annual report below. You can navigate through the pages in the report by either clicking on the pages listed below, or by using the keyword search tool below to find specific information within the annual report.-
 1
1 -
 2
2 -
 3
3 -
 4
4 -
 5
5 -
 6
6 -
 7
7 -
 8
8 -
 9
9 -
 10
10 -
 11
11 -
 12
12 -
 13
13 -
 14
14 -
 15
15 -
16
-
17
-
18
-
19
-
20
-
21
-
22
-
23
-
24
-
25
-
26
-
27
-
28
-
29
-
30
-
31
-
32
-
33
-
34
-
35
-
36
-
37
-
38
-
39
-
40
-
41
-
42
-
43
-
44
-
45
-
46
-
47
-
48
-
49
-
50
-
51
-
52
-
53
-
54
-
55
-
56
-
57
-
58
-
59
-
60
-
61
-
62
-
63
-
64
-
65
-
66
-
67
-
68
-
69
-
70
-
71
-
72
-
73
-
74
-
75
-
76
-
77
-
78
-
79
-
80
-
81
-
82
-
83
-
84
-
85
-
86
-
87
-
88
-
89
-
90
-
91
-
92
-
93
-
94
-
95
-
96
-
97
-
98
-
99
-
100
-
101
-
102
-
103
-
104
-
105
-
106
-
107
-
108
-
109
-
110
-
111
-
112
-
113
-
114
-
115
-
116
-
117
-
118
-
119
-
120
-
121
-
122
-
123
-
124
-
125
-
126
-
127
-
128
-
129
-
130
-
131
-
132
-
133
-
134
-
135
-
136
-
137
-
138
-
139
-
140
-
141
-
142
-
143
-
144
-
145
-
146
-
147
-
148
-
149
-
150
-
151
-
152
-
153
-
154
-
155
-
156
-
157
-
158
-
159
-
160
-
161
-
162
-
163
-
164
-
165
-
166
-
167
-
168
-
169
-
170
-
171
-
172
-
173
-
174
-
175
-
176
-
177
-
178
-
179
-
180
-
181
-
182
 |
 |

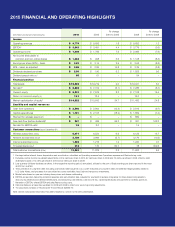
2010 FINANCIAL AND OPERATING HIGHLIGHTS
% change % change
($ in millions except per share amounts) 2010 2009 2010 to 2009 2008 2010 to 2008
Income
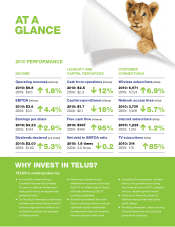
Operating revenues $ß 9,779 $ß 9,606 1.8 $ß 9,653 1.3
EBITDA1 $ß 3,643 $ß 3,491 4.4 $ß 3,779 (3.6)
Operating income $ß 1,908 $ß 1,769 7.9 $ß 2,066 (7.6)
Net income attributable to
common and non-voting shares $ß 1,034 $ 998 3.6 $ß 1,128 (8.3)
Earnings per share (EPS) – basic $ß 3.23 $ß 3.14 2.9 $ß 3.52 (8.2)
EPS – basic, as adjusted2 $ß 3.26 $ß 2.84 14.8 $ß 3.39 (3.8)
Dividends declared per share $ß 2.00 $ß 1.90 5.3 $ß 1.825 9.6
Dividend payout ratio (%)3 65 61 – 54 –
Financial position
Total assets $ß19,599 $ß19,219 2.0 $ß19,021 3.0
Net debt4 $ß 6,869 $ß 7,312 (6.1) $ß 7,286 (5.7)
Owners’ equity $ß 8,201 $ß 7,575 8.3 $ß 7,108 15.4
Return on common equity (%) 13.1 13.4 – 16.0 –
Market capitalization of equity5 $ß14,332 $ß10,642 34.7 $ß11,483 24.8
Liquidity and capital resources
Cash from operations $ß 2,546 $ß 2,904 (12.3) $ß 2,819 (9.7)
Capital expenditures $ß 1,721 $ß 2,103 (18.2) $ß 1,859 (7.4)
Payment for wireless spectrum $ – $ – – $ 882 –
Free cash flow (before dividends)6 $ 947 $ 485 95.3 $ 361 162.3
Net debt to EBITDA ratio7 1.8 2.0 – 1.9 –
Customer connections (as at December 31)
Wireless subscribers (000s) 6,971 6,524 6.9 6,129 13.7
Network access lines (000s)8 3,739 3,966 (5.7) 4,176 (10.5)
Internet subscribers (000s) 1,229 1,215 1.2 1,220 0.7
TV subscribers (000s)9 314 170 84.7 78 302.6
Total customer connections (000s) 12,253 11,875 3.2 11,603 5.6
1 Earnings before interest, taxes, depreciation and amortization, calculated as Operating revenues less Operations expense and Restructuring costs.
2 Excludes positive income tax-related adjustments of nine cents per share in 2010, 52 cents per share in 2009 and 13 cents per share in 2008, offset by debt
redemption losses of 12 cents per share in 2010 and 22 cents per share in 2009.
3 Last quarterly dividend declared per share, in the respective reporting period, annualized, divided by the sum of Basic earnings per share reported in the most
recent four quarters.
4 The summation of Long-term debt excluding unamortized debt issuance cost, current maturities of Long-term debt, net deferred hedging liability related to
U.S. dollar Notes, and proceeds from securitized accounts receivable, less Cash and temporary investments.
5 Market value based on year-end closing share prices and shares outstanding.
6 EBITDA as reported, deducting donations expense and securitization fees, adjusted for payments in excess of expense for share-based compensation,
restructuring initiatives and defined benefit plans, and deducting cash interest, cash income tax, capital expenditures and payment for wireless spectrum.
7 Net debt to EBITDA, where EBITDA excludes Restructuring costs.
8 Historical Network access lines updated for 2009 and 2008 to reflect prior period reporting adjustments.
9 TV subscribers consists of TELUS Optik TV and TELUS Satellite TV.
Note: Certain comparative information has been restated to conform to the 2010 presentation.