Telus 2010 Annual Report Download - page 49
Download and view the complete annual report
Please find page 49 of the 2010 Telus annual report below. You can navigate through the pages in the report by either clicking on the pages listed below, or by using the keyword search tool below to find specific information within the annual report.-
 1
1 -
2
-
3
-
4
-
5
-
6
-
7
-
8
-
9
-
10
-
11
-
12
-
13
-
14
-
15
-
16
-
17
-
18
-
19
-
20
-
21
-
22
-
23
-
24
-
25
-
26
-
27
-
28
-
29
-
30
-
31
-
32
-
33
-
34
-
35
-
36
-
37
-
38
-
 39
39 -
 40
40 -
 41
41 -
 42
42 -
 43
43 -
 44
44 -
 45
45 -
 46
46 -
 47
47 -
 48
48 -
 49
49 -
 50
50 -
 51
51 -
 52
52 -
 53
53 -
 54
54 -
 55
55 -
 56
56 -
 57
57 -
 58
58 -
 59
59 -
60
-
61
-
62
-
63
-
64
-
65
-
66
-
67
-
68
-
69
-
70
-
71
-
72
-
73
-
74
-
75
-
76
-
77
-
78
-
79
-
80
-
81
-
82
-
83
-
84
-
85
-
86
-
87
-
88
-
89
-
90
-
91
-
92
-
93
-
94
-
95
-
96
-
97
-
98
-
99
-
100
-
101
-
102
-
103
-
104
-
105
-
106
-
107
-
108
-
109
-
110
-
111
-
112
-
113
-
114
-
115
-
116
-
117
-
118
-
119
-
120
-
121
-
122
-
123
-
124
-
125
-
126
-
127
-
128
-
129
-
130
-
131
-
132
-
133
-
134
-
135
-
136
-
137
-
138
-
139
-
140
-
141
-
142
-
143
-
144
-
145
-
146
-
147
-
148
-
149
-
150
-
151
-
152
-
153
-
154
-
155
-
156
-
157
-
158
-
159
-
160
-
161
-
162
-
163
-
164
-
165
-
166
-
167
-
168
-
169
-
170
-
171
-
172
-
173
-
174
-
175
-
176
-
177
-
178
-
179
-
180
-
181
-
182
 |
 |

TELUS 2010 annual report . 45
MANAGEMENT’S DISCUSSION & ANALYSIS: 1
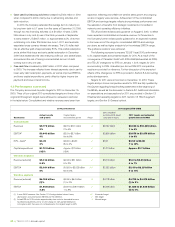
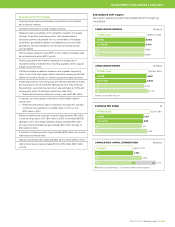
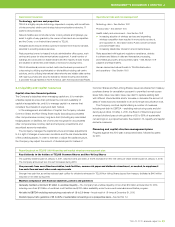
Consolidated 2011 targets
See Caution regarding forward-looking statements at the beginning
of the MD&A.
10
09
08
07
06
CONSOLIDAT ED REVENUE ($ millions)
11 IFRS target 9,925 to 10,225
9,606
9,653
9,792
9,779
10 IFRS
10 C-GAAP
09
08
06
10
09
08
07
06
CONSOLIDAT ED EBITDA ($ millions)
11 IFRS target 3,675 to 3,875
3,491
3,779
3,650
3,643
10 IFRS
10 C-GAAP
09
08
06
EBITDA is a non-GAAP measure.
10
09
08
07
06
EARNINGS PER SHARE ($)
11 IFRS target 3.50 to 3.90
3.14
3.52
3.27
3.23
10 IFRS
10 C-GAAP
09
08
06
10
09
08
07
CONSOLIDAT ED CAPITA L EXPENDITURES ($ millions)
11 target approx. 1,700
2,741
8821,859
1,721
2,10 3
10
09
08
General capital expendituresPayment for AWS spectrum licences
Assumptions for 2011 targets
Ongoing intense wireline and wireless competition in both business
and consumer markets
Continued downward re-pricing of legacy services
Wireless industry penetration of the Canadian population to increase
between 4.5 and five percentage points, with wireless industry
subscriber growth to accelerate due to a combination of increased
competition, accelerated adoption of smartphones and use of data
applications, and the emergence of new types of wireless devices
such as tablets
TELUS wireless domestic voice ARPU erosion offset by increased data
and international roaming ARPU growth
Wireless acquisition and retention expenses to increase due to
increased loading of smartphones, including upgrades, and to support
a larger subscriber base
Continued wireline broadband expansion and upgrades supporting
Optik TV and Optik High Speed Internet subscriber revenue growth that
offsets the continued erosion in network access line-related revenues
A preliminary pension accounting discount rate was estimated at 5.35%
and subsequently set at 5.25% (60 basis points lower than 2010) and
the preliminary expected long-term return was estimated at 7.25% and
subsequently set at 7% (25 basis points lower than 2010)
.Defined benefit pension plans net recovery was set at $34 million
A voluntary one-time pension contribution of $200 million made in
January 2011
.Defined benefit pension plans contributions including the voluntary
contribution are estimated to be $298 million in 2011, up from
$137 million in 2010
Efficiency initiatives are expected to result in approximately $50 million
in restructuring costs in 2011 ($74 million in 2010). Incremental EBITDA
savings for 2011 were initially estimated at approximately $75 million
and are currently estimated at approximately $50 million (savings of
$134 million in 2010)
A reduction in financing costs of approximately $135 million due to lower
debt levels and interest rates
Statutory income tax rate of approximately 26.5 to 27.5% (29% in 2010)
Cash income taxes of approximately $130 to $180 million ($311 million
in 2010)