Telus 2010 Annual Report Download - page 38
Download and view the complete annual report
Please find page 38 of the 2010 Telus annual report below. You can navigate through the pages in the report by either clicking on the pages listed below, or by using the keyword search tool below to find specific information within the annual report.-
 1
1 -
2
-
3
-
4
-
5
-
6
-
7
-
8
-
9
-
10
-
11
-
12
-
13
-
14
-
15
-
16
-
17
-
18
-
19
-
20
-
21
-
22
-
23
-
24
-
25
-
26
-
27
-
 28
28 -
 29
29 -
 30
30 -
 31
31 -
 32
32 -
 33
33 -
 34
34 -
 35
35 -
 36
36 -
 37
37 -
 38
38 -
 39
39 -
 40
40 -
 41
41 -
 42
42 -
 43
43 -
 44
44 -
 45
45 -
 46
46 -
 47
47 -
 48
48 -
49
-
50
-
51
-
52
-
53
-
54
-
55
-
56
-
57
-
58
-
59
-
60
-
61
-
62
-
63
-
64
-
65
-
66
-
67
-
68
-
69
-
70
-
71
-
72
-
73
-
74
-
75
-
76
-
77
-
78
-
79
-
80
-
81
-
82
-
83
-
84
-
85
-
86
-
87
-
88
-
89
-
90
-
91
-
92
-
93
-
94
-
95
-
96
-
97
-
98
-
99
-
100
-
101
-
102
-
103
-
104
-
105
-
106
-
107
-
108
-
109
-
110
-
111
-
112
-
113
-
114
-
115
-
116
-
117
-
118
-
119
-
120
-
121
-
122
-
123
-
124
-
125
-
126
-
127
-
128
-
129
-
130
-
131
-
132
-
133
-
134
-
135
-
136
-
137
-
138
-
139
-
140
-
141
-
142
-
143
-
144
-
145
-
146
-
147
-
148
-
149
-
150
-
151
-
152
-
153
-
154
-
155
-
156
-
157
-
158
-
159
-
160
-
161
-
162
-
163
-
164
-
165
-
166
-
167
-
168
-
169
-
170
-
171
-
172
-
173
-
174
-
175
-
176
-
177
-
178
-
179
-
180
-
181
-
182
 |
 |
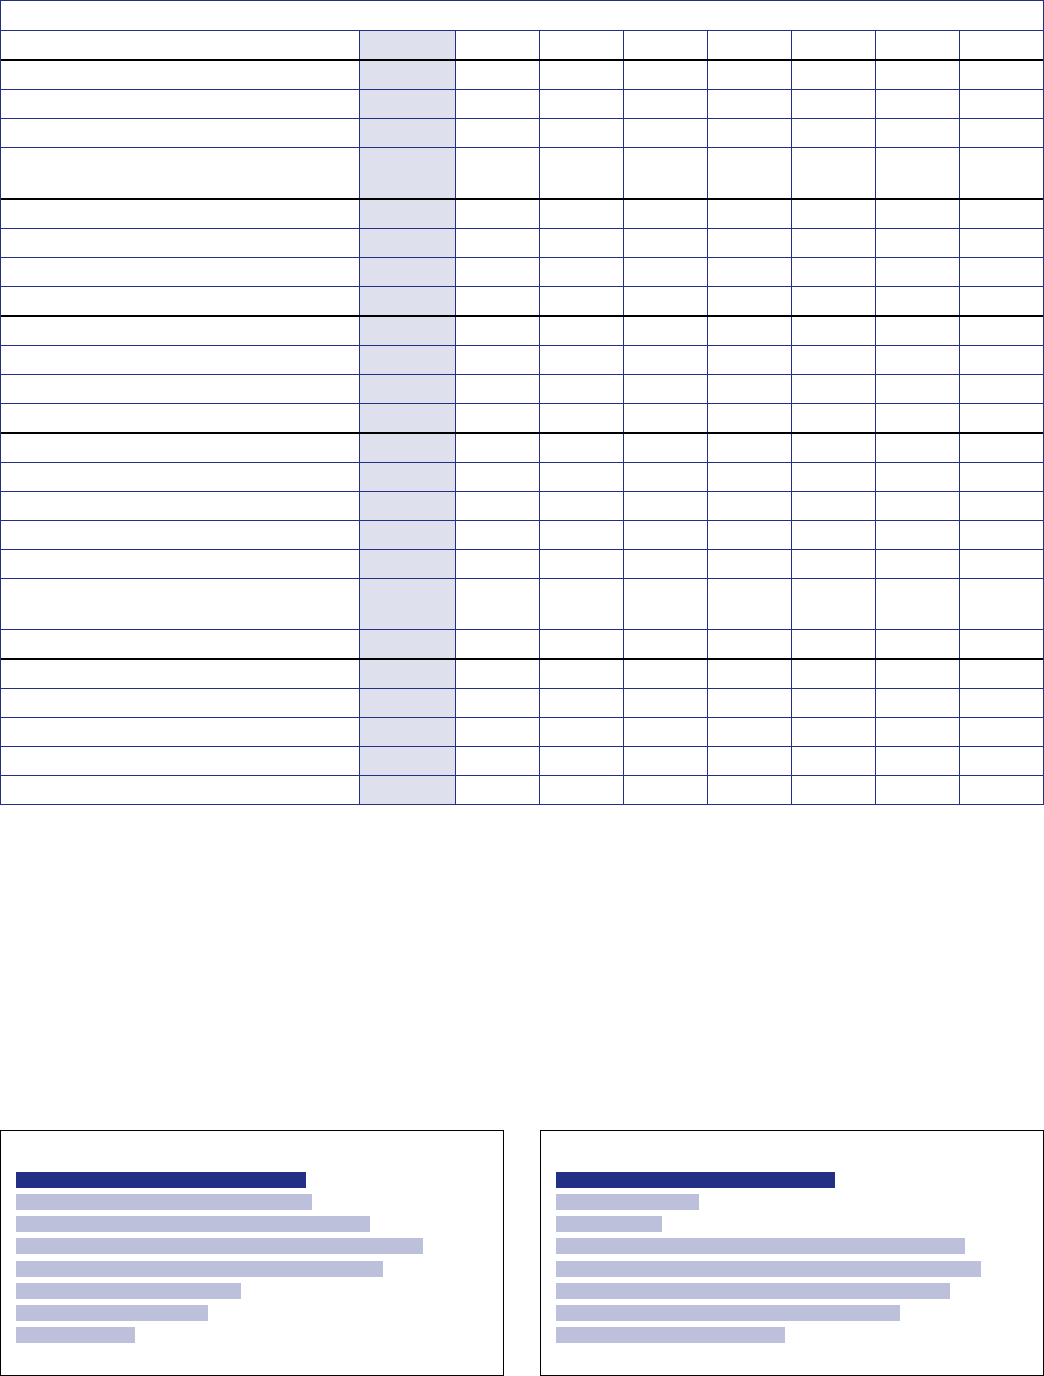
34 . TELUS 2010 annual report
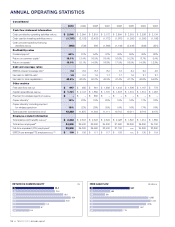
13.4
13.1
8.7
5.4
16.6
10.2
18.4
16.0
RETURN ON COMMON EQUITY (%)
10
09
08
07
06
05
04
03
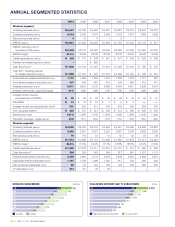
ANNUAL OPERATING STATISTICS
Consolidated
2010 2009 2008 2007 2006 2005 2004 2003
Cash flow statement information
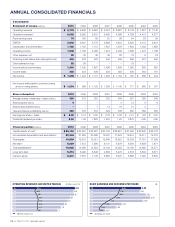
Cash provided by operating activities (millions) $ß 2,546 $ß 2,904 $ß 2,819 $ß 3,172 $ß 2,804 $ß 2,915 $ß 2,538 $ß 2,134
Cash used by investing activities (millions) (1,707) (2,128) (3,433) (1,772) (1,675) (1,355) (1,300) (1,198)
Cash provided (used) by financing
activities (millions) (863) (739) 598 (1,369) (1,149) (2,448) (348) (921)
Profitability ratios
Dividend payout1 65% 61% 54% 47% 45% 55% 49% 62%
Return on common equity2 13.1% 13.4% 16.0% 18.4% 16.6% 10.2% 8.7% 5.4%
Return on assets3 13.0% 15.1% 14.8% 18.8% 17.0% 18.0% 14.3% 12.3%
Debt and coverage ratios
EBITDA interest coverage ratio4 7.3 6.9 8.3 8.2 7.3 5.4 5.2 4.5
Net debt to EBITDA ratio5 1.8 2.0 1.9 1.7 1.7 1.9 2.1 2.7
Net debt to total capitalization 45.5% 48.9% 50.2% 46.9% 47.4% 47.7% 48.6% 54.8%
Other metrics
Free cash flow (millions)6 $ 947 $ 485 $ 361 $ß 1,388 $ß 1,443 $ß 1,336 $ß 1,167 $ 776
Capital expenditures (millions) $ß 1,721 $ß 2,103 $ß 1,859 $ß 1,770 $ß 1,618 $ß 1,319 $ß 1,319 $ß 1,253
Payment for wireless spectrum (millions) $ – $ – $ 882 $ – $ – $ – $ – $ –
Capex intensity7 18% 22% 19% 20% 19% 16% 17% 18%
Capex intensity7 including payment
for wireless spectrum 18% 22% 28% 20% 19% 16% 17% 18%
Total customer connections (000s)8 12,253 11,875 11,603 11,111 10,715 10,211 9,716 9,175
Employee-related information
Total salaries and benefits (millions)9 $ß 2,233 $ß 2,303 $ß 2,326 $ß 2,329 $ß 2,028 $ß 1,897 $ß 1,914 $ß 1,859
Total active employees10 34,800 36,400 36,600 34,200 31,900 29,800 25,800 24,700
Full-time equivalent (FTE) employees11 33,900 35,300 35,900 33,400 31,100 n.m. 24,800 23,800
EBITDA per average FTE employee (000s)11,12 $ 109 $ 106 $ 111 $ 117 $ 126 n.m. $ 130 $ 119
485
947
1,167
776
1,443
1,336
1,388
361
FREE CASH FLOW ($ millions)
10
09
08
07
06
05
04
03