Telus 2010 Annual Report Download - page 62
Download and view the complete annual report
Please find page 62 of the 2010 Telus annual report below. You can navigate through the pages in the report by either clicking on the pages listed below, or by using the keyword search tool below to find specific information within the annual report.-
 1
1 -
2
-
3
-
4
-
5
-
6
-
7
-
8
-
9
-
10
-
11
-
12
-
13
-
14
-
15
-
16
-
17
-
18
-
19
-
20
-
21
-
22
-
23
-
24
-
25
-
26
-
27
-
28
-
29
-
30
-
31
-
32
-
33
-
34
-
35
-
36
-
37
-
38
-
39
-
40
-
41
-
42
-
43
-
44
-
45
-
46
-
47
-
48
-
49
-
50
-
51
-
 52
52 -
 53
53 -
 54
54 -
 55
55 -
 56
56 -
 57
57 -
 58
58 -
 59
59 -
 60
60 -
 61
61 -
 62
62 -
 63
63 -
 64
64 -
 65
65 -
 66
66 -
 67
67 -
 68
68 -
 69
69 -
 70
70 -
 71
71 -
 72
72 -
73
-
74
-
75
-
76
-
77
-
78
-
79
-
80
-
81
-
82
-
83
-
84
-
85
-
86
-
87
-
88
-
89
-
90
-
91
-
92
-
93
-
94
-
95
-
96
-
97
-
98
-
99
-
100
-
101
-
102
-
103
-
104
-
105
-
106
-
107
-
108
-
109
-
110
-
111
-
112
-
113
-
114
-
115
-
116
-
117
-
118
-
119
-
120
-
121
-
122
-
123
-
124
-
125
-
126
-
127
-
128
-
129
-
130
-
131
-
132
-
133
-
134
-
135
-
136
-
137
-
138
-
139
-
140
-
141
-
142
-
143
-
144
-
145
-
146
-
147
-
148
-
149
-
150
-
151
-
152
-
153
-
154
-
155
-
156
-
157
-
158
-
159
-
160
-
161
-
162
-
163
-
164
-
165
-
166
-
167
-
168
-
169
-
170
-
171
-
172
-
173
-
174
-
175
-
176
-
177
-
178
-
179
-
180
-
181
-
182
 |
 |

58 . TELUS 2010 annual report
and operating results, as well as inclusion of a full year of expenses
from Black’s Photo, acquired in September 2009. Defined benefit
pension plan expenses, principally in the wireline segment, were
$28 million in 2010, up by $10 million from 2009.
.Other operations expenses increased by $219 million. The increase
was mainly due to higher wireless subscriber acquisition and retention
costs, higher TELUS TV costs related to the 85% increase in the
subscriber base over 12 months, and inclusion of a full year of Black’s
Photo expenses. These increases were partly offset by lower wireline
expenses as a result of efficiency initiatives, supplier credits and
one-time operating savings.
Restructuring costs
Restructuring costs decreased by $116 million in 2010 when compared
to 2009, reflecting a relatively high level of restructuring activities in the
wireline segment in the prior year period. Restructuring costs in 2010
were primarily severance costs and charges for vacating and subletting
certain real estate space, in respect of efficiency initiatives described
in Investing in internal capabilities in Section 2.2. A full-year expense of
approximately $50 million is expected for efficiency initiatives in 2011
(see Key assumptions in Section 1.5).
EBITDA
EBITDA increased by $152 million in 2010 when compared to 2009.
The increase was primarily due to lower restructuring costs and traction
from efficiency initiatives, supplemented by a high margin application
software sale and one-time operating savings in the first quarter of 2010.
Wireless EBITDA increased by $98 million in 2010 when compared to
2009, while wireline EBITDA increased year-over-year by $54 million.
Depreciation; Amortization of intangible assets
Combined depreciation and amortization expenses increased by
$13 million in 2010 when compared to 2009.
.Depreciation decreased by $8 million in 2010 when compared to
2009. Growth in TELUS TV and broadband capital assets was largely
offset by lower depreciation due to asset life changes determined in
a continuing program of asset life studies (including an increase in
the estimated useful life for TELUS TV set-top boxes in 2010), certain
computer hardware and digital cell sites becoming fully depreciated
(while the majority remain in service) and lower retirements in 2010.
.Amortization of intangible assets increased $21 million in 2010 when
compared to 2009. Growth in software assets, including application
software supporting wireless HSPA+ services, was partly offset by
lower amortization for other fully amortized software assets still in
use. Amortization was reduced by investment tax credits for assets
capitalized in prior years that are now fully amortized (reductions
of approximately $5 million in 2010 and $10 million in 2009).
.The Company completed its annual impairment testing for intangible
assets and goodwill in December 2010, and it was determined that
there were no impairments. See subtopics Intangible assets, net and
Goodwill, net in Section 8.1 Critical accounting estimates.
Operating income
Operating income increased $139 million in 2010 when compared to
2009, as higher EBITDA and lower depreciation expenses were partially
offset by increased amortization expenses.
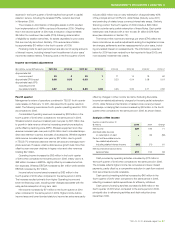
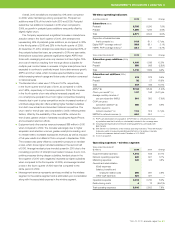
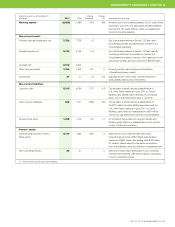
5.3 Consolidated operations
Years ended December 31
($ millions, except
EBITDA margin and employees) 2010 2009 Change
Operating revenues 9,779 9,606 1.8%
Operations expense 6,062 5,925 2.3%
Restructuring costs 74 190 (61.1)%
EBITDA(1) 3,643 3,491 4.4%
Depreciation 1,333 1,341 (0.6)%
Amortization of intangible assets 402 381 5.5%
Operating income 1,908 1,769 7.9%
EBITDA margin (%)(2) 37.3 36.3 1.0 pt.
Full-time equivalent (FTE) employees 33,900 35,300 (4.0)%
pt(s) – percentage point(s).
(1) EBITDA is a non-GAAP measure. See Section 11.1 Earnings before interest, taxes,
depreciation and amortization (EBITDA).
(2) EBITDA divided by Operating revenues.
Discussion of TELUS’ consolidated operations follows. Segmented
discussion is provided in Section 5.4 Wireless segment, Section 5.5
Wireline segment and Section 7.2 Cash used by investing activities –
capital expenditures.
Operating revenues
Consolidated Operating revenues increased by $173 million in 2010
when compared to 2009, as wireless growth continued to exceed wire-
line revenue declines. Wireless network revenue increased year-over-year
by $219 million due to growth in data revenue driven by increasing
smartphone adoption, partly offset by declining voice ARPU. Wireless
equipment and other revenue increased year-over-year by $88 million
due to increased acquisition and retention volumes, sales of accessories
and inclusion of a full year’s results from Black’s Photo, acquired in
September 2009. Wireline segment data revenue increased year-over-
year by $122 million due to growth in TELUS TV, enhanced data and
Internet services and managed workplace revenues. However, wireline
data revenue growth was more than offset by year-over-year declines
in legacy voice and other revenues totalling $256 million.
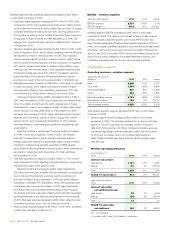
Operations expense
Operations expense increased by $137 million in 2010 when compared
to 2009.
Years ended December 31
($ millions) 2010 2009 Change
Salaries, benefits and
employee-related costs 2,311 2,393 (3.4)%
Other operations expenses 3,751 3,532 6.2%
6,062 5,925 2.3%
In respect of changes in operations expense in 2010 when compared
to 2009:
.Salaries, benefits and employee-related costs decreased by $82 mil-
lion. The decrease was mainly due to lower wireline base salaries
reflecting fewer domestic full-time equivalent (FTE) employees and
a reduction of discretionary employee-related expenses, partially
offset by labour rate inflation in 2010 and increased employee per-
formance bonus compensation expenses due to improved financial