Telus 2010 Annual Report Download - page 150
Download and view the complete annual report
Please find page 150 of the 2010 Telus annual report below. You can navigate through the pages in the report by either clicking on the pages listed below, or by using the keyword search tool below to find specific information within the annual report.-
 1
1 -
2
-
3
-
4
-
5
-
6
-
7
-
8
-
9
-
10
-
11
-
12
-
13
-
14
-
15
-
16
-
17
-
18
-
19
-
20
-
21
-
22
-
23
-
24
-
25
-
26
-
27
-
28
-
29
-
30
-
31
-
32
-
33
-
34
-
35
-
36
-
37
-
38
-
39
-
40
-
41
-
42
-
43
-
44
-
45
-
46
-
47
-
48
-
49
-
50
-
51
-
52
-
53
-
54
-
55
-
56
-
57
-
58
-
59
-
60
-
61
-
62
-
63
-
64
-
65
-
66
-
67
-
68
-
69
-
70
-
71
-
72
-
73
-
74
-
75
-
76
-
77
-
78
-
79
-
80
-
81
-
82
-
83
-
84
-
85
-
86
-
87
-
88
-
89
-
90
-
91
-
92
-
93
-
94
-
95
-
96
-
97
-
98
-
99
-
100
-
101
-
102
-
103
-
104
-
105
-
106
-
107
-
108
-
109
-
110
-
111
-
112
-
113
-
114
-
115
-
116
-
117
-
118
-
119
-
120
-
121
-
122
-
123
-
124
-
125
-
126
-
127
-
128
-
129
-
130
-
131
-
132
-
133
-
134
-
135
-
136
-
137
-
138
-
139
-
 140
140 -
 141
141 -
 142
142 -
 143
143 -
 144
144 -
 145
145 -
 146
146 -
 147
147 -
 148
148 -
 149
149 -
 150
150 -
 151
151 -
 152
152 -
 153
153 -
 154
154 -
 155
155 -
 156
156 -
 157
157 -
 158
158 -
 159
159 -
 160
160 -
161
-
162
-
163
-
164
-
165
-
166
-
167
-
168
-
169
-
170
-
171
-
172
-
173
-
174
-
175
-
176
-
177
-
178
-
179
-
180
-
181
-
182
 |
 |

146 . TELUS 2010 annual report
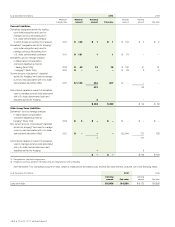
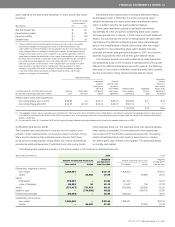
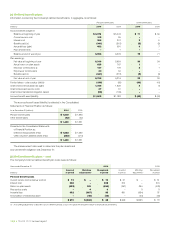
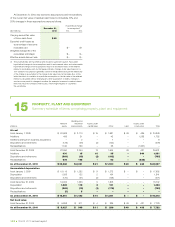
(a) Defined benefit plans
Information concerning the Company’s defined benefit plans, in aggregate, is as follows:
Pension benefit plans Other benefit plans
(millions) 2010 2009 2010 2009
Accrued benefit obligation:
Balance at beginning of year $ß6,376 $ß5,243 $ 71 $ 64
Current service cost 103 85 – –
Interest cost 368 374 5 5
Benefits paid (c) (341) (318) (5) (5)
Actuarial loss (gain) 452 991 4 7
Plan amendments – 1 – –
Balance at end of year (d)-(e) 6,958 6,376 75 71
Plan assets (g):
Fair value at beginning of year 6,316 5,654 30 34
Actual return on plan assets 623 767 1 –
Employer contributions (j) 137 179 3 1
Employees’ contributions 30 34 – –
Benefits paid (c) (341) (318) (5) (5)
Fair value at end of year 6,765 6,316 29 30
Funded status – plan surplus (deficit) (193) (60) (46) (41)
Unamortized net actuarial loss (gain) 1,726 1,528 4 (1)
Unamortized past service costs 27 31 – –
Unamortized transitional obligation (asset) (58) (106) – –
Accrued benefit asset (liability) $ß1,502 $ß1,393 $ß(42) $ß(42)
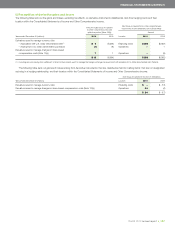
The accrued benefit asset (liability) is reflected in the Consolidated
Statements of Financial Position as follows:
As at December 31 (millions) 2010 2009
Pension benefit plans $ß1,502 $ß1,393
Other benefit plans (42) (42)
$ß1,460 $ß1,351
Presented in the Consolidated Statements
of Financial Position as:
Deferred charges (Note 21(b)) $ß1,683 $ß1,565
Other long-term liabilities (Note 21(b)) (223) (214)
$ß1,460 $ß1,351
The measurement date used to determine the plan assets and
accrued benefit obligation was December 31.
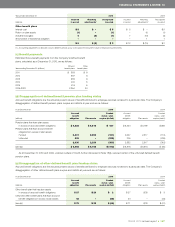
(b) Defined benefit plans – cost
The Company’s total net defined benefit plan costs were as follows:
Years ended December 31 2010 2009
Incurred Matching Recognized Incurred Matching Recognized
(millions) in period adjustments(1) in period in period adjustments(1) in period
Pension benefit plans
Current service cost (employer portion) $ß 73 $ – $ß 73 $ß 51 $ – $ß 51
Interest cost 368 – 368 374 – 374
Return on plan assets (623) 169 (454) (767) 364 (403)
Past service costs – 4 4 – 3 3
Actuarial loss 452 (367) 85 991 (954) 37
Amortization of transitional asset – (48) (48) – (44) (44)
$ß270 $ß(242) $ß 28 $ß649 $ß(631) $ß 18
(1) Accounting adjustments to allocate costs to different periods so as to recognize the long-term nature of employee future benefits.