Telus 2010 Annual Report Download - page 44
Download and view the complete annual report
Please find page 44 of the 2010 Telus annual report below. You can navigate through the pages in the report by either clicking on the pages listed below, or by using the keyword search tool below to find specific information within the annual report.-
 1
1 -
2
-
3
-
4
-
5
-
6
-
7
-
8
-
9
-
10
-
11
-
12
-
13
-
14
-
15
-
16
-
17
-
18
-
19
-
20
-
21
-
22
-
23
-
24
-
25
-
26
-
27
-
28
-
29
-
30
-
31
-
32
-
33
-
 34
34 -
 35
35 -
 36
36 -
 37
37 -
 38
38 -
 39
39 -
 40
40 -
 41
41 -
 42
42 -
 43
43 -
 44
44 -
 45
45 -
 46
46 -
 47
47 -
 48
48 -
 49
49 -
 50
50 -
 51
51 -
 52
52 -
 53
53 -
 54
54 -
55
-
56
-
57
-
58
-
59
-
60
-
61
-
62
-
63
-
64
-
65
-
66
-
67
-
68
-
69
-
70
-
71
-
72
-
73
-
74
-
75
-
76
-
77
-
78
-
79
-
80
-
81
-
82
-
83
-
84
-
85
-
86
-
87
-
88
-
89
-
90
-
91
-
92
-
93
-
94
-
95
-
96
-
97
-
98
-
99
-
100
-
101
-
102
-
103
-
104
-
105
-
106
-
107
-
108
-
109
-
110
-
111
-
112
-
113
-
114
-
115
-
116
-
117
-
118
-
119
-
120
-
121
-
122
-
123
-
124
-
125
-
126
-
127
-
128
-
129
-
130
-
131
-
132
-
133
-
134
-
135
-
136
-
137
-
138
-
139
-
140
-
141
-
142
-
143
-
144
-
145
-
146
-
147
-
148
-
149
-
150
-
151
-
152
-
153
-
154
-
155
-
156
-
157
-
158
-
159
-
160
-
161
-
162
-
163
-
164
-
165
-
166
-
167
-
168
-
169
-
170
-
171
-
172
-
173
-
174
-
175
-
176
-
177
-
178
-
179
-
180
-
181
-
182
 |
 |

40 . TELUS 2010 annual report
The discussion in this section is qualified in its entirety by the Caution
regarding forward-looking statements at the beginning of the MD&A.
1.1 Preparation of the MD&A
The Company’s disclosure controls and procedures are designed
to provide reasonable assurance that all relevant information is
gathered and reported to senior management on a timely basis, so
that appropriate decisions can be made regarding public disclosure.
(See Disclosure controls and procedures in Section 4.4.) Management
determines whether or not information is material based on whether
it believes a reasonable investor’s decision to buy, sell or hold securities
in the Company would likely be influenced or changed if the information
were omitted or misstated. The MD&A and the Consolidated financial
statements were reviewed by TELUS’ Audit Committee and approved
by TELUS’ Board of Directors.
Management has issued guidance on and reports on certain
non-GAAP measures to evaluate performance of the Company and
its segments. Non-GAAP measures are also used to determine
compliance with debt covenants and manage the capital structure.
Because non-GAAP measures do not generally have a standardized
meaning, securities regulations require that non-GAAP measures
be clearly defined and qualified, and reconciled with their nearest
GAAP measure. The Canadian Institute of Chartered Accountants (CICA)
Canadian Performance Reporting Board has issued guidelines that
define standardized earnings before interest, taxes, depreciation and
amortization (EBITDA) and standardized free cash flow. While EBITDA
and free cash flow discussed in this document are management’s
definitions, reconciliations to the standardized definitions are provided
in Section 11.
1.2 Canadian economy and
telecommunications industry
Economic environment
Canada’s economy grew by an estimated 2.9% in 2010 after contracting
by 2.5% in 2009. The Bank of Canada reported in its January 2011
Monetary Report that it expects Canada’s real gross domestic product
(GDP) growth will be 2.4% in 2011 and 2.8% in 2012. Statistics Canada’s
December 2010 Labour Force Survey reported the unemployment rate
at 7.6%, down from a revised 8.5% in December 2009.
Telecommunications industry
The Company estimates that Canadian telecommunications industry
revenue growth was approximately 2% in 2010, as compared to approxi-
mately 1% in 2009. The engines of industry growth were wireless and
wireline data services, which more than offset declining revenues
from legacy wireline voice services and pricing pressures on wireless
voice revenues.
Canadian wireless industry revenue and EBITDA growth for 2010
are estimated at approximately 5% and 3%, respectively, as compared
to 3.2% and 3.1%, respectively, in 2009. Increased competitive intensity
(including new or re-launched brands from incumbents and market entry
or expansion by entrants), new smartphones and an improved economy
attracted approximately 1.7 million new industry subscribers in 2010,
or an approximate 4.4 percentage point increase in penetration to
approximately 73% of the population. The wireless penetration rate in
Canada is expected to further increase in 2011 by between 4.5 and
five percentage points.
The Canadian wireline sector is expected to continue to face pres-
sure on legacy voice services from strong competitive intensity and
technological substitution to growing data and wireless services. Growth
opportunities remain in wireline data, including Internet, and IP-based TV
and entertainment services.
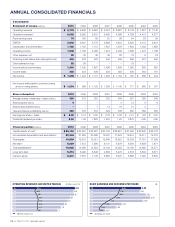
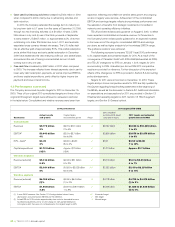
1.3 Consolidated highlights
($ millions, unless noted otherwise)
Years ended December 31 2010 2009 Change
Consolidated statements
of income
Operating revenues 9,779 9,606 1.8%
Operating income 1,908 1,769 7.9%
Income before income taxes 1,366 1,205 13.4%
Net income 1,038 1,002 3.6%
Earnings per share (EPS)(1)
– basic ($) 3.23 3.14 2.9%
EPS(1) – diluted ($) 3.22 3.14 2.5%
Cash dividends declared
per share(1) ($) 2.00 1.90 5.3%
Average shares(1) outstanding
– basic (millions) 320 318 0.6%
Consolidated statements
of cash flows
Cash provided by operating activities 2,546 2,904 (12.3)%
Cash used by investing activities 1,707 2,128 (19.8)%
Capital expenditures 1,721 2,103 (18.2)%
Cash used by financing activities 863 739 16.8%
Other measures
Subscriber connections(2) (thousands) 12,253 11,875 3.2%
EBITDA(3) 3,643 3,491 4.4%
Free cash flow(3) 947 485 95.3%
Net debt to EBITDA – excluding
restructuring costs (times)(4) 1.8 2.0 (0.2)
(1) Includes Common Shares and Non-Voting Shares.
(2) The sum of wireless subscribers, network access lines (NALs), Internet access
subscribers and TELUS TV subscribers (Optik TVTM and TELUS Satellite TV®
subscribers), measured at the end of the respective periods based on information
in billing and other systems. NALs at December 31, 2009, reflect prior period
restatements made in the first quarter of 2010.
(3) EBITDA and free cash flow are non-GAAP measures. See Section 11.1 Earnings
before interest, taxes, depreciation and amortization (EBITDA) and Section 11.2 Free
cash flow.
(4) See Section 7.4 Liquidity and capital resource measures and Section 11.4 Definitions
of liquidity and capital resource measures.
1INTRODUCTION
A summary of TELUS’ consolidated results for 2010, performance against
2010 targets, and presentation of targets for 2011